
Clarity
This effect allows you to manipulate the local contrast in an image.
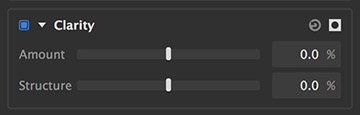
- Amount: Manipulates the contrast between larger areas or surfaces in the image. Increasing the value boosts contrast in these areas, decreasing reduces the contrast in these areas.
- Structure: Manipulate the contrast of the fine details in the image. Increasing the value increases the contrast in these areas, decreasing removes the contrast effectively smoothing things. It acts like a mostly artifact and halo free sharpen for very fine details. It works particularly well on textures likee fabrics and facial hair.
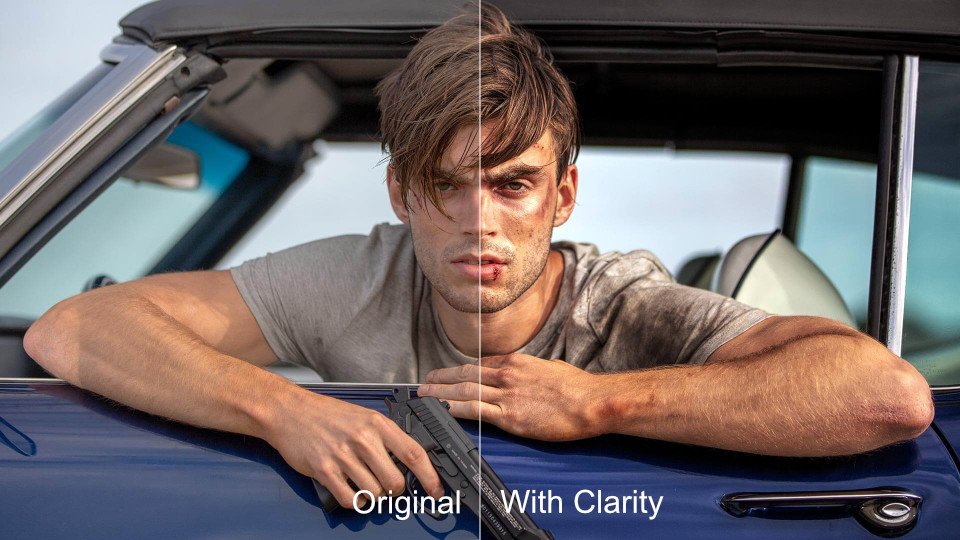
Here is an example image show the effects of the clarity amount slider:
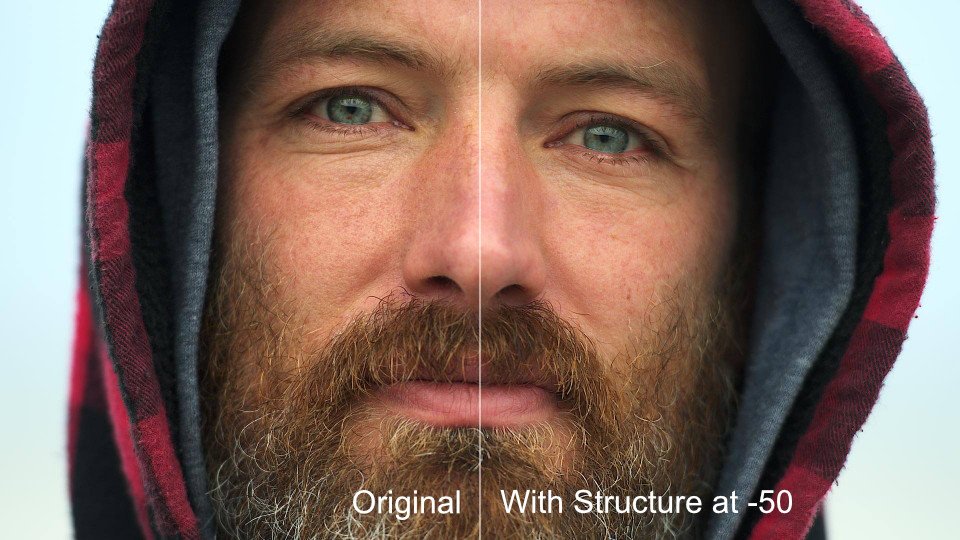
Here is an example of an image which uses the structure slider to manipulate the fine details like skin pores and facial hair. First we can emphasise these details by using a positive amount:

We can also decrease the structure to smooth details:
Curves
Curves are a powerful tool for adjusting colors and tones within your image. The graph displays a histogram of all the values present in the currently selected channel. The diagonal line is the curve you will edit, and it represents the relationship between the input values and output values of your image.
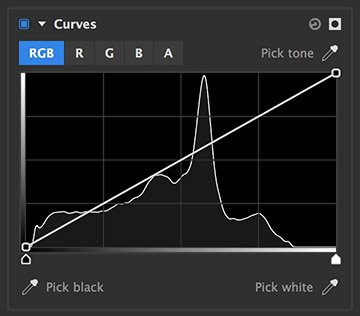
- Channel selector: Choose the channel that you wish to edit
- RGB: Averages the RGB values together, and creates a curve based on those averages.
- R: Select the red channel alone.
- G: Select the green channel alone.
- B: Select the blue channel alone.
- A: Select the alpha channel of the image.
- Pick tone: You can click anywhere on the curve to add a point for adjustment. If you want to select a specific tone from your image, you can click-drag the pipette to the color of your choice.
- Curve graph: The graph displays a histogram of all the values present in the currently selected channel. The diagonal line is the curve you will edit
- Black point: The point which originates at the bottom left corner of the graph represents black. Drag the point right to darken the blacks in your image, and drag it upward to lighten the blacks.
- White point: The point which originates at the top right corner of the graph represents white. Drag the point left to brighten the whites in your image, and drag it downward to darken the whites.
- Additional points: In most cases you will want additional points to edit the midtones in your image. The most common curves adjustment is an s-curve to improve contrast, where one point is added about 1/4 of the way up the diagonal line, and shifted slightly downward, and a second point is added about 3/4 of the way up the diagonal line, and shifted slightly upward.
- Pick black: Click-drag the pipette to an area in your image that should be true black, to set the black point.
- Pick white: Click-drag the pipette to an area in your image that should be true white, to set the white point.
Dehaze
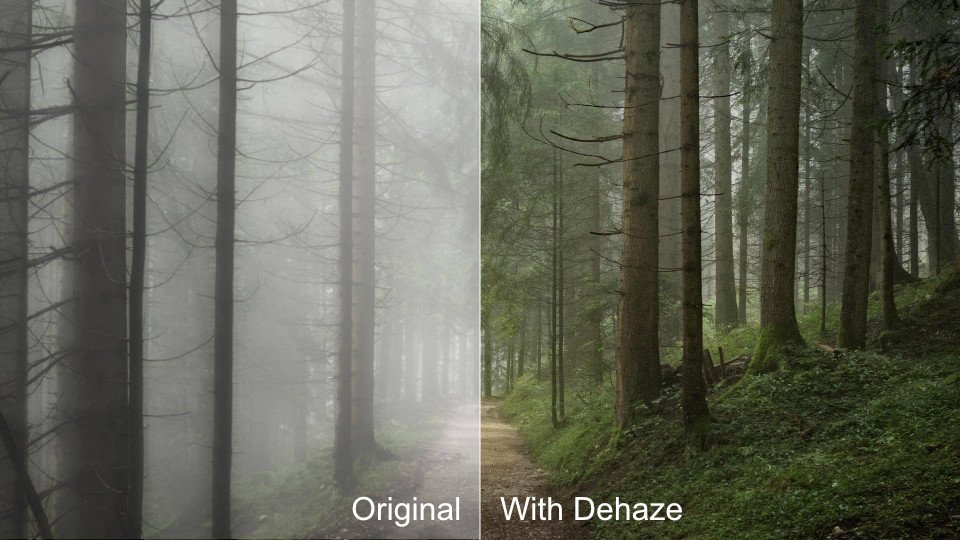
This allows you to remove haze to your images which is a white wash over your image caused by particles in the atmosphere reflecting pure white light in front of your subject. Its particularly effective on hazy skies or fog. It does so by estimaing the distance each item in your image is from the camera at the time of shot and adds or removes white based on this distance along with the amount you specify.
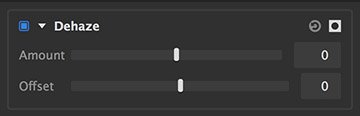
- Amount: How much haze do you want to remove (positive value) or add (negative value).
- Offset: Sometimes dehazing can result in color artifacting in blown out skies (usually yellow and magenta), this lets you tweak those to make them white again.
Here is an example of this effect in action. On the left side is the original image with quite a lot of haze. On the right side is the image after being put through the dehaze effect:
Exposure
Allows you to change brighten and darken various tonal areas of your image and affect the saturation.
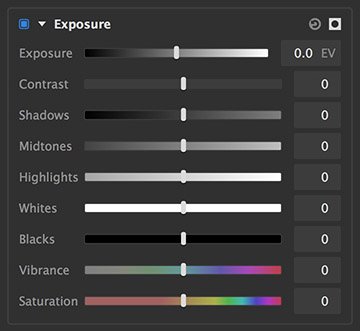
- Exposure: This either brightens or darkens the entire image. It does so in such a way where every stop (EV) is a doubling (when increasing) or halving (when decreasing) of the brightness. This better matches the behaviour of exposure in cameras.
- Contrast: This increases the difference between the brightest and darkest pixels in your image by stretching its histogram.
- Shadows: Brightens or darkens the darkest areas of your image. On a histogram this corresponds to the area on the left.
- Midtones: Brightens or darkens the areas not considered shadow or highlights. On a histogram this corresponds to the middle area.
- Highlights: Brightens or darkens the brightest areas of your image. On a histogram this corresponds to the area on the right.
- Whites: Changes the white point of an image.
- Blacks: Changes the black point of an image image.
- Vibrance: This increases the intensity of color but protects skintones and is aware of how saturated things are already putting less increase on already saturated colors.
- Saturation: This increases the intensity of color across your entire image.
Levels
Levels gives you detailed information about the channel composition of the layer through the user of a Histogram Display. This histogram shows information about the image just before the effect is applied. This allows you to make adjustments to the tonality of the layer based on this information. A Histogram is a graph which allows you to quickly see at a glance the exact range of tonal values in the image. The histogram gives you a more accurate way to assess colors and tones than by eye as humans can percieve them slightly differently.
The tones in the histogram represent pure black on the left and pure white on the right. For colors this translates to how saturated each channel is. The height of the graph at any point inficates the relative frequency of that specific tone in the image.
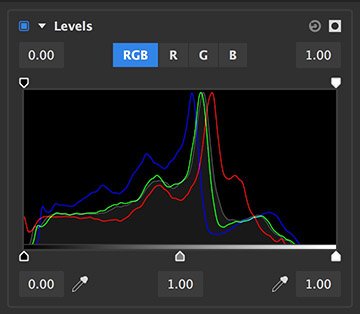
- Channel selector: Allows you to view and manipulate specific channels in isolation or all together.
- RGB: Views all the R, G and B channels and manipulates all of them evenly. In addition it will show luminance channel as a grey line (which represents brightness).
- R: Views and manipulates just the red channel.
- G: Views and manipulates just the green channel.
- B: Views and manipulates just the blue channel.
- Set output white: Offsets the white point of the image from 1.0 to the selected value. This is useful for lightening the shadows in the image.
- Set output black: Offsets the black point of the image from 1.0 to the selected value. This is useful for reducing the brightness of the highlights in your image.
- Set input black: Some images may not have any tones at the black end of the chart. This can usually indicate something is overexposed or lacks contrast. You can set the input black and it will be mapped onto the output black. If you only change the input black this will map a grey tone to black which essentially stretches the histogram.
- Set output gamma: Redistributes the midtones between the defined input black and input white. Moving gamma to the left will brighten, and to the right will darken.
- Set input white: Some images may not have any tones at the white end of the chart. This can usually indicate something is underexposed or lacks contrast. You can set the input white and it will be mapped onto the output white. If you only change the input white this will map a grey tone to white which essentially stretches the histogram.
Need more help with this?
Don’t hesitate to contact us here.