
Vizualizing aggregate data, and telling the story of your organization’s work, can be accomplished by working out of the ‘Reports’ tab, found in the top navigation menu.
Each RDP instance includes 22 ready-to-run reports that include:
- Activity Logs
- CRS
- CRS Averages
- Engagement Scale
- User Login Records (Adoption)
- ORS
- ORS Averages
- ORS to CRS
- Recovery Capital Scale
- Recovery Capital Scale Averages
- RRS
- RRS Averages
- RRS to CRS
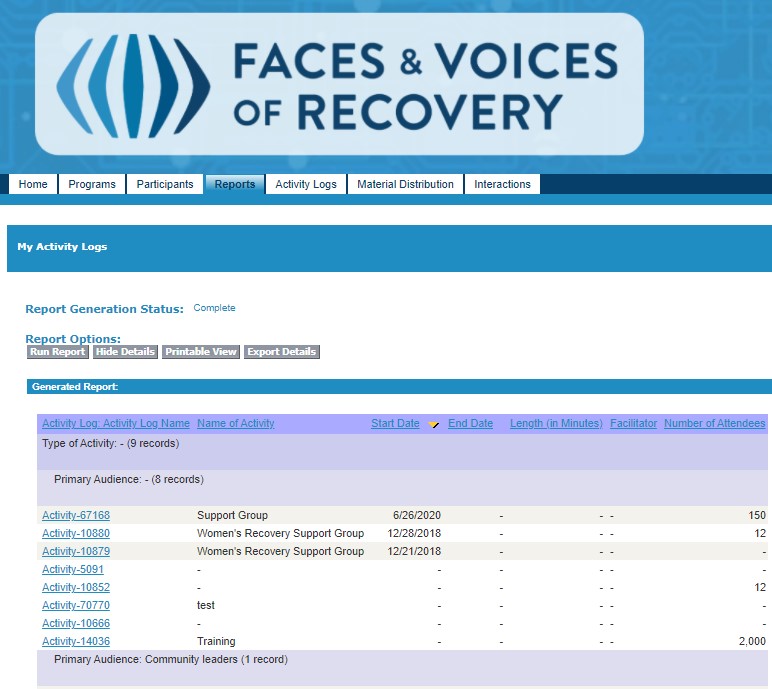
Each of these reports can be ran by clicking on the ‘All Reports’ tab, and then clicking on the appropriate report. You can also utilize the report search bar if you’re having trouble.
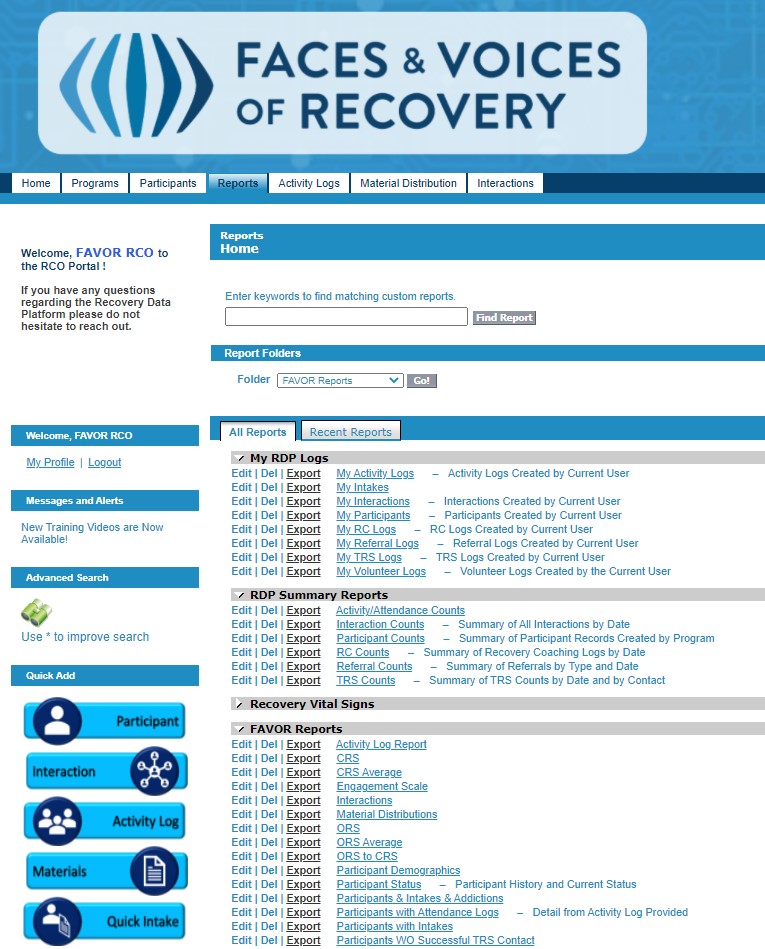
Each report can be printed or exported by clicking on the grey ‘Printable View’ or ‘Export Details’ buttons.
In the event that your organization needs to build custom reports, please reach out to rdp@facesandvoicesofrecovery.org. We are able to work with your organization to identify the best solution.
Post your comment on this topic.