
The various report types will give you information about location, input state (see the Fleet section for details on inputs), operational hours and more.
You generate a report by following this procedure:
1 Click the appropriate report icon from the overview screen.
2 Each report type will prompt you for the specifics you wish to inspect:
| Description | Fields |
| History This report will give you the full history of a single unit. You get a full report of location and inputs every two minutes when the unit is moving. When the unit is not moving you get a sample every 15 minutes. This is the report you want if you want to know exactly where a unit was at a certain time. 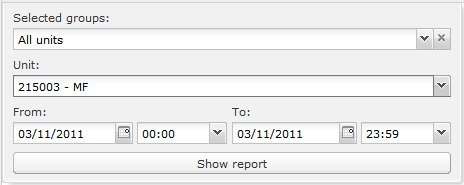 The report includes the following information for every sample:
|
 Selected groups: By selecting a group you will narrow down the list of units to choose from in the next field. You can leave this to all units if you do not wish to filter. Unit: The unit you wish to generate a report for. When you start typing the interface will come up with a filtered list of units that match your typing. From and To: Time frame for the report. From and to dates/times are both included in the report. |
| Vehicle behaviour The vehicle behaviour report displays traffic violations (such as speeding, no seat belt etc.) committed by the unit. 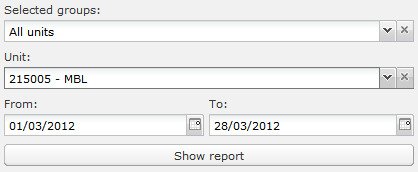 The report begins with a summary of all traffic violations, spread over all units. In addition to this, the report includes the following information for every sample:
|
 Selected groups: By selecting a group you will narrow down the list of units to choose from in the next field. You can leave this to all units if you do not wish to filter. Unit: The unit you wish to generate a report for. When you start typing the interface will come up with a filtered list of units that match your typing. From and To: Time frame for the report. From and to dates are both included in the report. |
| Driver behaviour The driver behaviour report gives you an insight into driving patterns, such as the number of harsh brakings, accelerations, overspeedings etc. This provides mainly a knowledge of the actual driving, but also a knowledge of how the units are worn on. 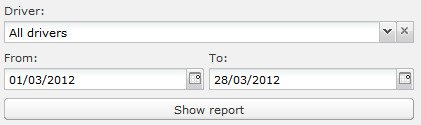 The report begins with a summary of driving “incidents” (acceleration, deceleration, braking, overspeeding, etc.) and violations spread over selected drivers. In addition to this, the report includes the following information for every sample.
|
 Driver: By selecting a driver, you can see the details of his driving across the units used. The list of drivers is maintained under the Access control tab. From and To: Time frame for the report. From and to dates are both included in the report. |
| Driver operational The driver operational report shows you how a unit has been used by the driver – how many kilometers moved, how many hours active etc. 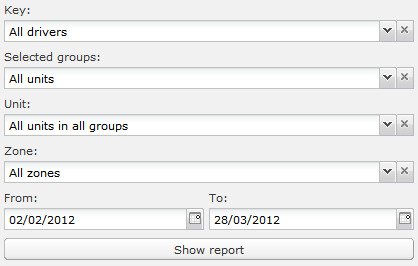 The report includes the following information for every sample.
|
 Key: By selecting a key (driver), you can see how much this has been used across the units used. Keys are maintained under the Access control tab. Selected groups: By selecting a group you will narrow down the list of units to choose from in the next field. You can leave this to all units if you do not wish to filter. Unit: The unit you wish to generate a report for. You can choose “all units in all groups” to include all units in the report. Zone: Limit the report to units in the selected zone. Leave this to “All zones” in order to include all units in your report. From and To: Time frame for the report. From and to dates are both included in the report. |
| Driver day The driver day report provides an overview of driver activity – how many working hours, and how many effective working hours. 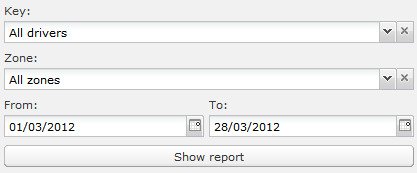 The report includes the following information for every sample.
|
 Key: By selecting a key (driver), you can see when this has been activated, and for how long. Keys are maintained under the Access control tab. Zone: Limit the report to units in the selected zone. Leave this to “All zones” in order to include all units in your report. From and To: Time frame for the report. From and to dates are both included in the report. |
| Activity An activity report tells you whenever there is a change in input state on a single unit. Instead of sampling the unit with a fixed time interval, as the history report, a line will be added to the report for every input state change, thus the report is comprised of a series of “time blocks” of varying duration. 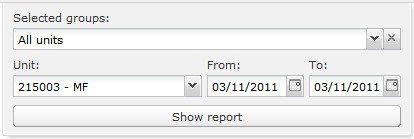 The report includes the following information for “time block”:
|
 Selected groups: By selecting a group you will narrow down the list of units to choose from in the next field. You can leave this to all units if you do not wish to filter. Unit: The unit you wish to generate a report for. When you start typing the interface will come up with a filtered list of units that match your typing. From and To: Time frame for the report. From and to dates are both included in the report. |
| Day The day report gives you a daily overview of unit activity. 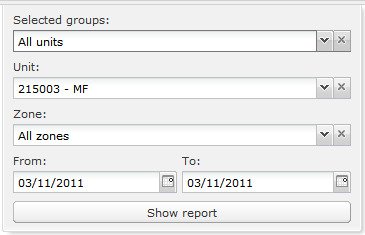 The report includes the following information per day for each unit:
|
 Selected groups: By selecting a group you will narrow down the list of units to choose from in the next field. You can leave this to all units if you do not wish to filter. Unit: The unit you wish to generate a report for. You can choose “all units in all groups” to include all units in the report. Zone: Limit the report to units in the selected zone. Leave this to “All zones” in order to include all units in your report. From and To: Time frame for the report. From and to dates are both included in the report. |
| Operational The operational report gives an aggregated overview of unit usage – how many kilometers moved, how many hours active etc. 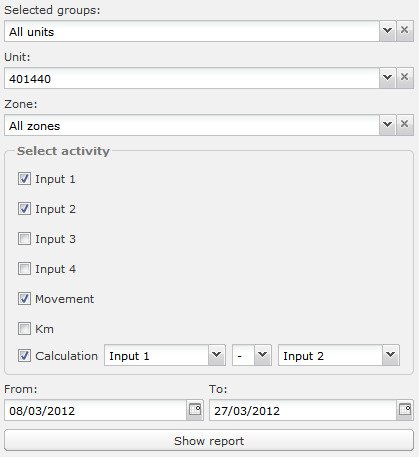 The report may include (whichever is selected) the following aggregated values per unit:
|
 Selected groups: By selecting a group you will narrow down the list of units to choose from in the next field. You can leave this to all units if you do not wish to filter. Unit: The unit you wish to generate a report for. When you start typing the interface will come up with a filtered list of units that match your typing. You can choose “all units in all groups” to include all units in the report. Zone: Limit the report to units in the selected zone. Leave this to “All zones” in order to include all units in your report. Select activity: Select which activities should be present in the report. From and To: Time frame for the report. From and to dates are both included in the report. |
| Start/stop A start/stop report lists all stretches of activity. Basically it is like the activity report, but the report entries are dictated by when the unit is moving, and not when there is an input state change. 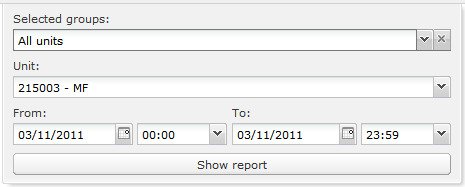 For each pair of start/stop times the report includes:
|
 Selected groups: By selecting a group you will narrow down the list of units to choose from in the next field. You can leave this to all units if you do not wish to filter. Unit: The unit you wish to generate a report for. When you start typing the interface will come up with a filtered list of units that match your typing. From and To: Time frame for the report. From and to dates/times are both included in the report. |
| Idle time An idle time report provides an overview of monthly activity for a unit, including daily driving-, stopping and idle times as well as total KM driven. 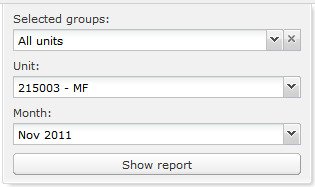 For each of the weeks of the chosen month, the report includes:
|
 Selected groups: By selecting a group you will narrow down the list of units to choose from in the next field. You can leave this to all units if you do not wish to filter. Unit: The unit you wish to generate a report for. When you start typing the interface will come up with a filtered list of units that match your typing. Month: Activity and idle times are displayed for all weeks in the chosen month. |
| Temperature The temperature report displays a graph of temperature1 and -2 values. This graph illustrates the evolvement of the temperatures during the trip. The report also highlightes minimum, average and maximum temperature values. 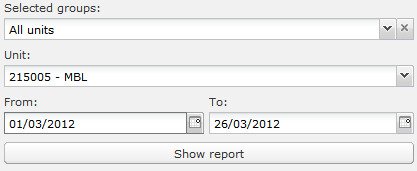 The report includes the following information for every sample:
|
 Selected groups: By selecting a group you will narrow down the list of units to choose from in the next field. You can leave this to all units if you do not wish to filter. Unit: The unit you wish to generate a report for. When you start typing the interface will come up with a filtered list of units that match your typing. From and To: Time frame for the report. From and to dates are both included in the report. |
| Exception An exception report will tell you if a unit has deviated from the norm defined by a period of time, or number of working hours. 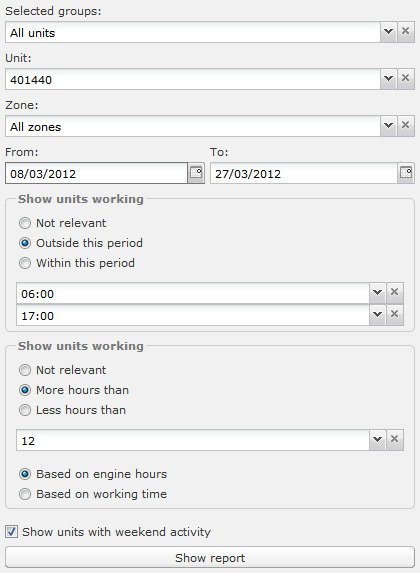 For each exception the report includes:
|
 From and To: Time frame for the report. From and to dates are both included in the report. Zone: Limit the report to units in the selected zone. Leave this to “All zones” in order to include all units in your report. Time frame: The time of day exception details must be displayed. Show units working: Filter the report data by hours or period. As an example, you can use the period option to only show units working from 6:00 AM to 17:00PM, excluding those working outside this period. And vice versa. As another example, you can use the hours option to only show units with daily operating hours equal to or greater than 12, excluding those with less than this. And vice versa. |

3 Once all fields are filled in correctly, the Show Report button will be active and you can click it to generate your report.
4 If you wish to save the report, click the Export to Excel or the Export to PDF button in the upper right hand corner.
If you wish to receive the same report moving forwards, you can schedule the report to be generated automatically – please see the Getting reports on email section.
Copyright © 2025 Safetrack
—
Powered by 