
Rollovers display
This section details the impact of rolling from one product to another. The following information is provided:
| Tab | Output type | Description |
|---|---|---|
| Total fees | Stacked column | Compares total fees for the existing product versus the recommended rollin product. |
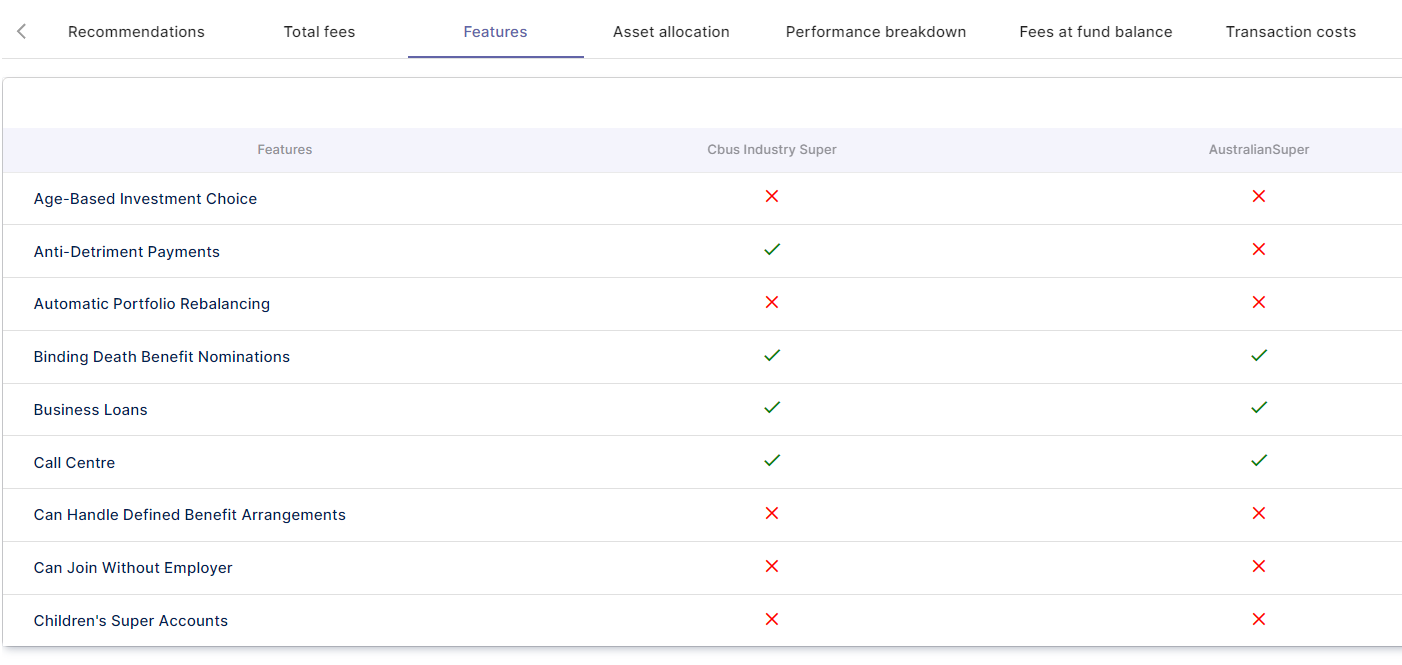
| Features | Table | Summary of all product features of the existing and recommended products. |
| Asset allocation per product | Multi-bar chart | Displays the asset allocation of the investments recommended within the new product versus the existing asset allocation of the current product. |
| Performance breakdown | Multi-bar chart | Displays the 1,3,5,7 & 10 year performance of the current product versus the existing product. |
| Fees at fund balance | Multi-bar chart | Compares the fees for the existing product versus the recommended product at various fund balances. |
| Transaction costs | Multi-bar chart | Specifies any transaction costs incurred in rolling from the existing product to the projected product. |
| Features gained/lost | Table | Determines any features gained/lost from implementing the rollover transactions. |
| Fee structure | Table | Specifies a breakdown of all fees within both the existing and proposed product in table format. |
| Investments | Table | Specifies all investment strategies available within both the existing and proposed product. |
Post your comment on this topic.