
Model comparison display
The model comparison section compares the projected advice model versus the no advice model. The difference in each model is captured via the following data:
| Tab | Output type | Description |
|---|---|---|
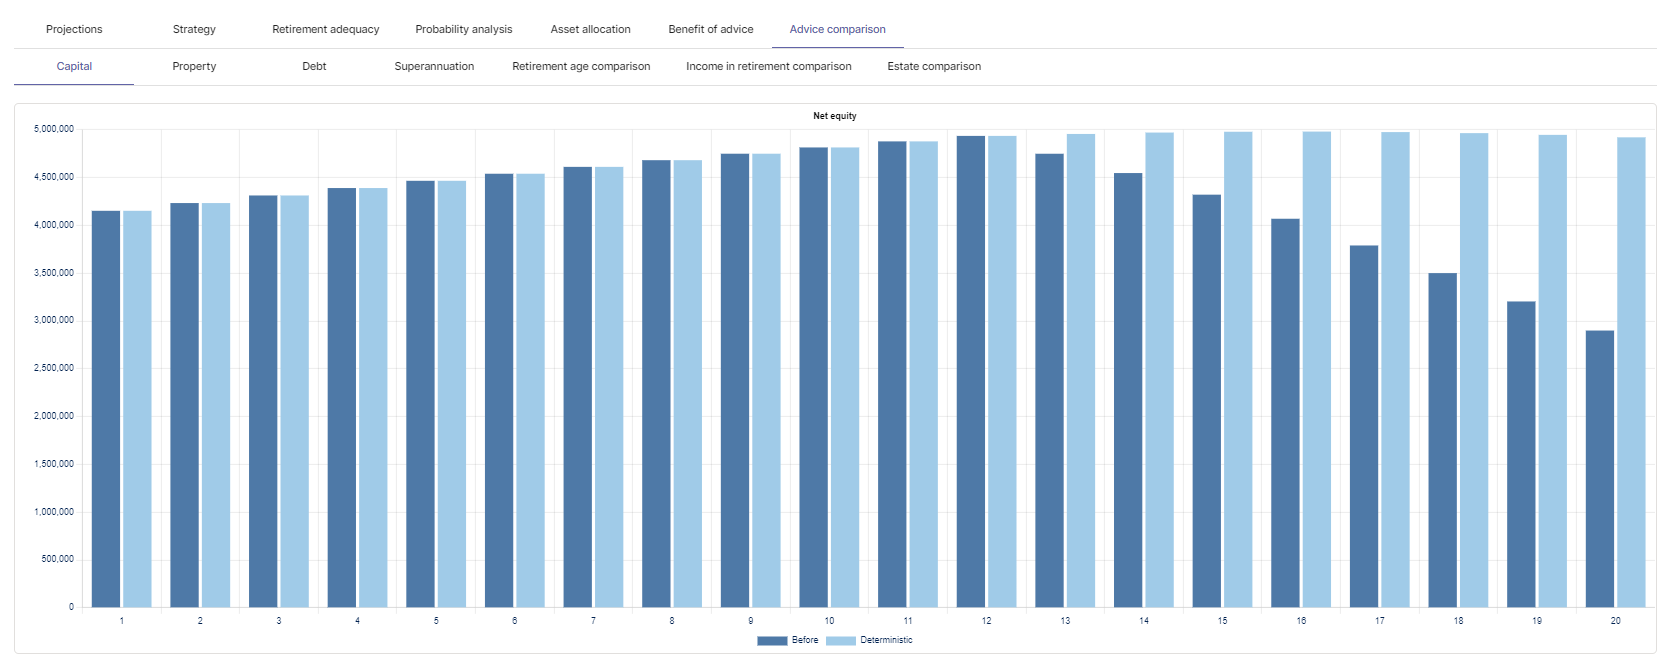
| Net equity | Multibar chart | This chart tracks the difference in net equity in the advice model versus the no advice model. |
| Property | Multibar chart | This chart tracks the difference in property value versus the no advice model. |
| Debt | Multibar chart | This chart tracks the difference in debt values versus the no advice model. |
| Superannuation | Multibar chart | This chart tracks the difference in superannuation values versus the no advice model. |
| Retirement age comparison | Column | This chart displays the minimum expected retirement age for both the advice model and no advice model. |
| Income in retirement comparison | Column | This chart displays the maximum expected retirement age for both the advice model and no advice model. |
| Estate comparison | Multibar chart | This chart tracks the expected death tax in the advice model versus the no advice model. |
Post your comment on this topic.