
Probability of outcome display
The PrimeSolve platform performs a Monte Carlo simulation in order to generate 1000 trials. The trials are then use to provide insight into the range of potential outcomes.
| Tab | Output type | Description |
|---|---|---|
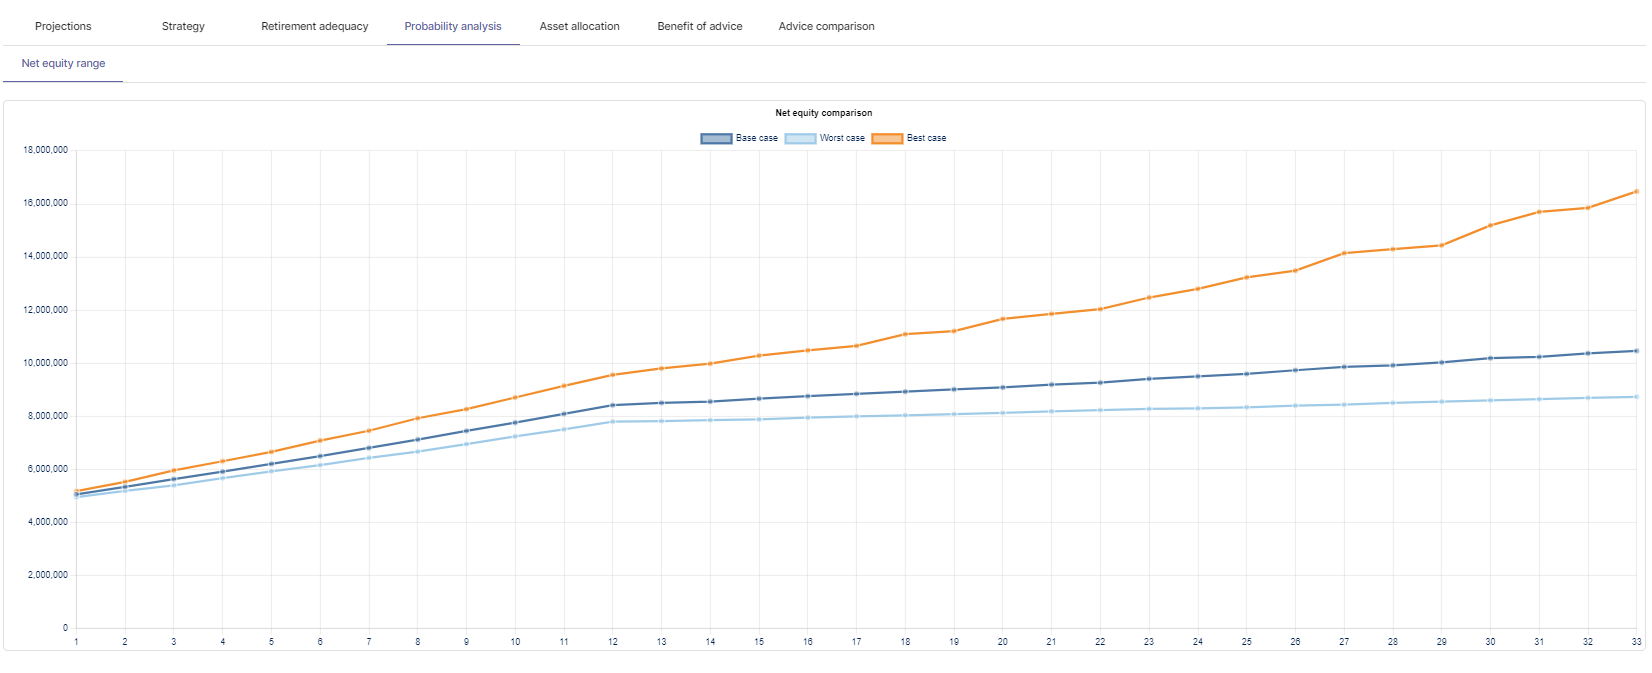
| Net equity comparison | Multi-bar chart | Displays the projected net equity position for different confidence intervals. The base case is the 50th percentile, the best case is the 90th percentile and the worst case is the 10% percentile. |
| Market crash impact | Line chart | Projects what would happen to net equity across historical crash scenarios. |
| Market crash recovery | Table | Outlines how long it would take to recover in the event of a market crash. |
| Lifestyle probability | Column chart | Determines the probability of funds lasting based on target income, and a modest and comfortable income. |
| Probability of equity wipeout | Multi-bar chart | Projects the probability of funds running out year by year. |
Post your comment on this topic.