
Property display
This section projects all properties grouped per entity.
| Tab | Output type | Description |
|---|---|---|
| Projection | Stacked column chart | Tracks all property values per entity on 1 chart. |
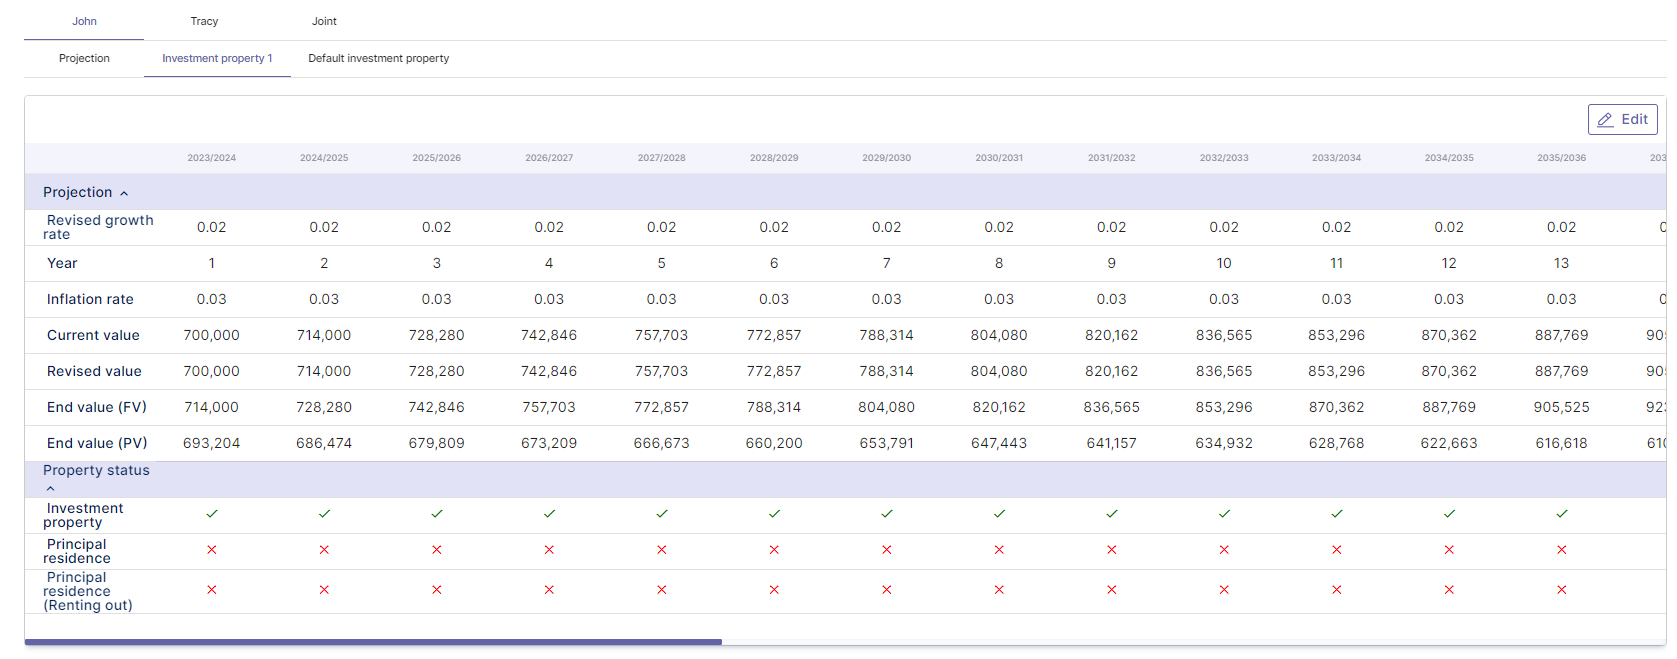
| Breakdown | Table | Projection of all property transaction year by year broken down per property. Transactions include; rental income, expenses, depreciation, purpose of the property. |
Post your comment on this topic.