
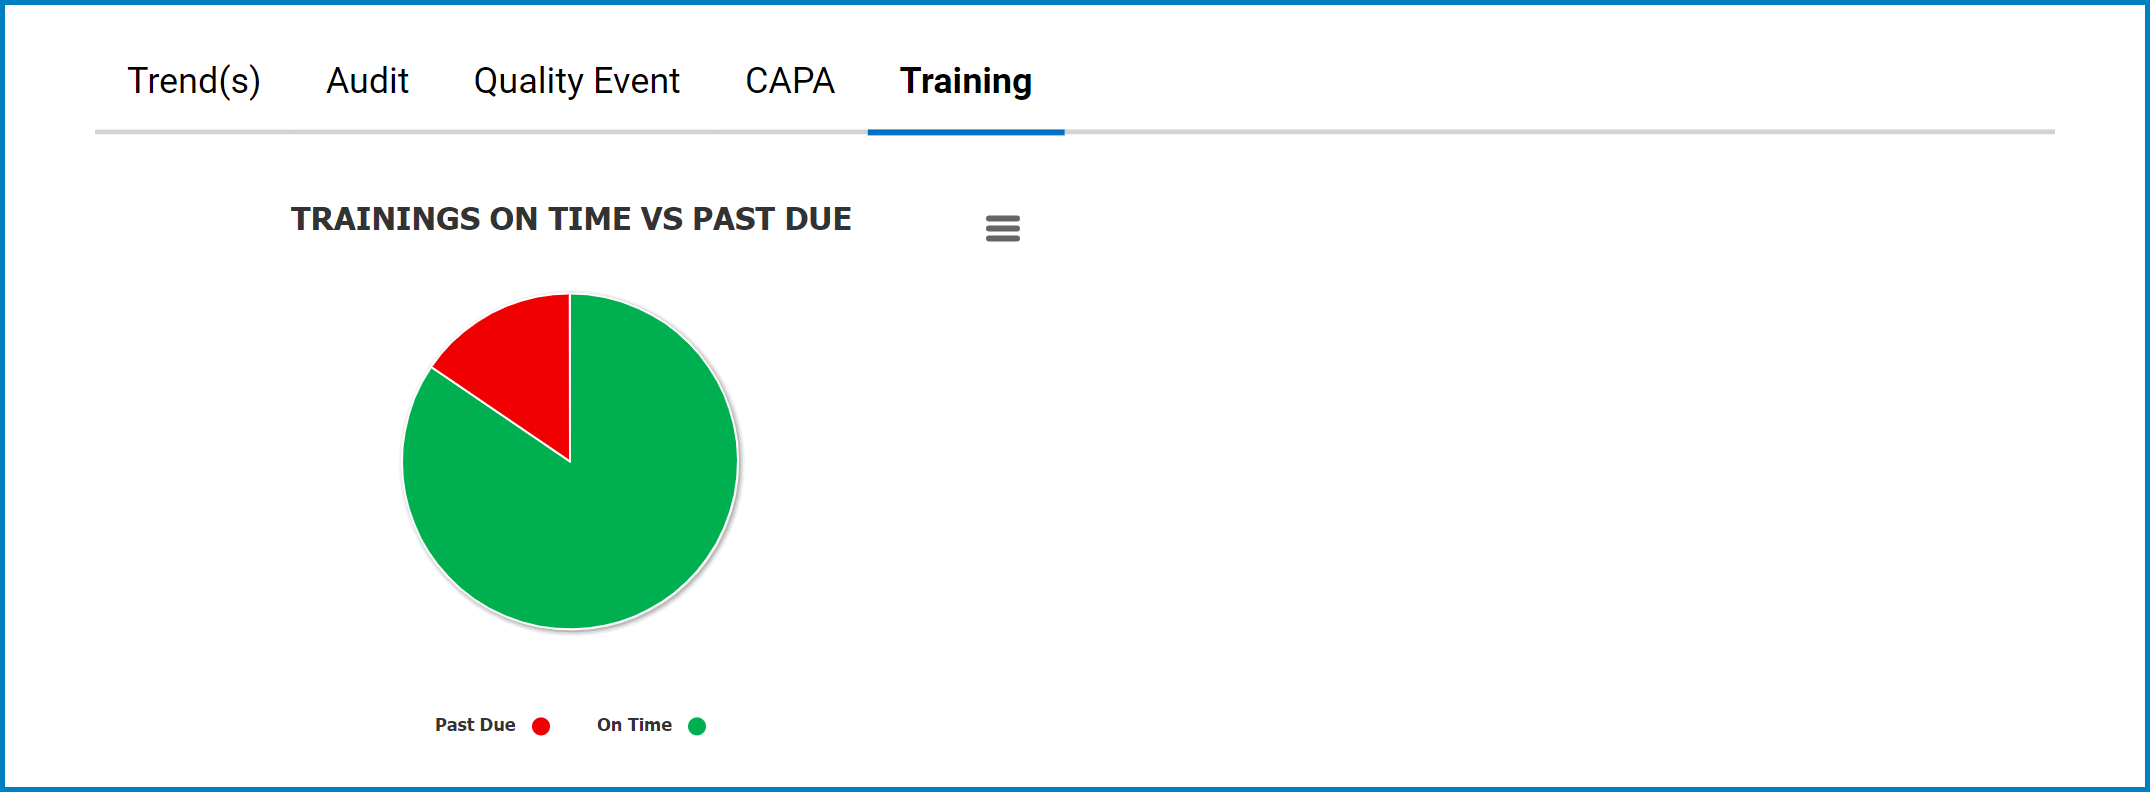
In this tab, users can access data related to the Training application.
- Chart Context Menus (
![]() ): These hamburger buttons, when clicked, reveal a menu with options for printing or downloading the chart.
): These hamburger buttons, when clicked, reveal a menu with options for printing or downloading the chart. - Data Count: This quantitative data is accessed by hovering your cursor over different data points in the pie chart (i.e., slices of the pie chart). It represents the number of trainings in each category.
![]()
- Drilldown Reports: These reports are accessed by double-clicking on specific data points in the pie chart.
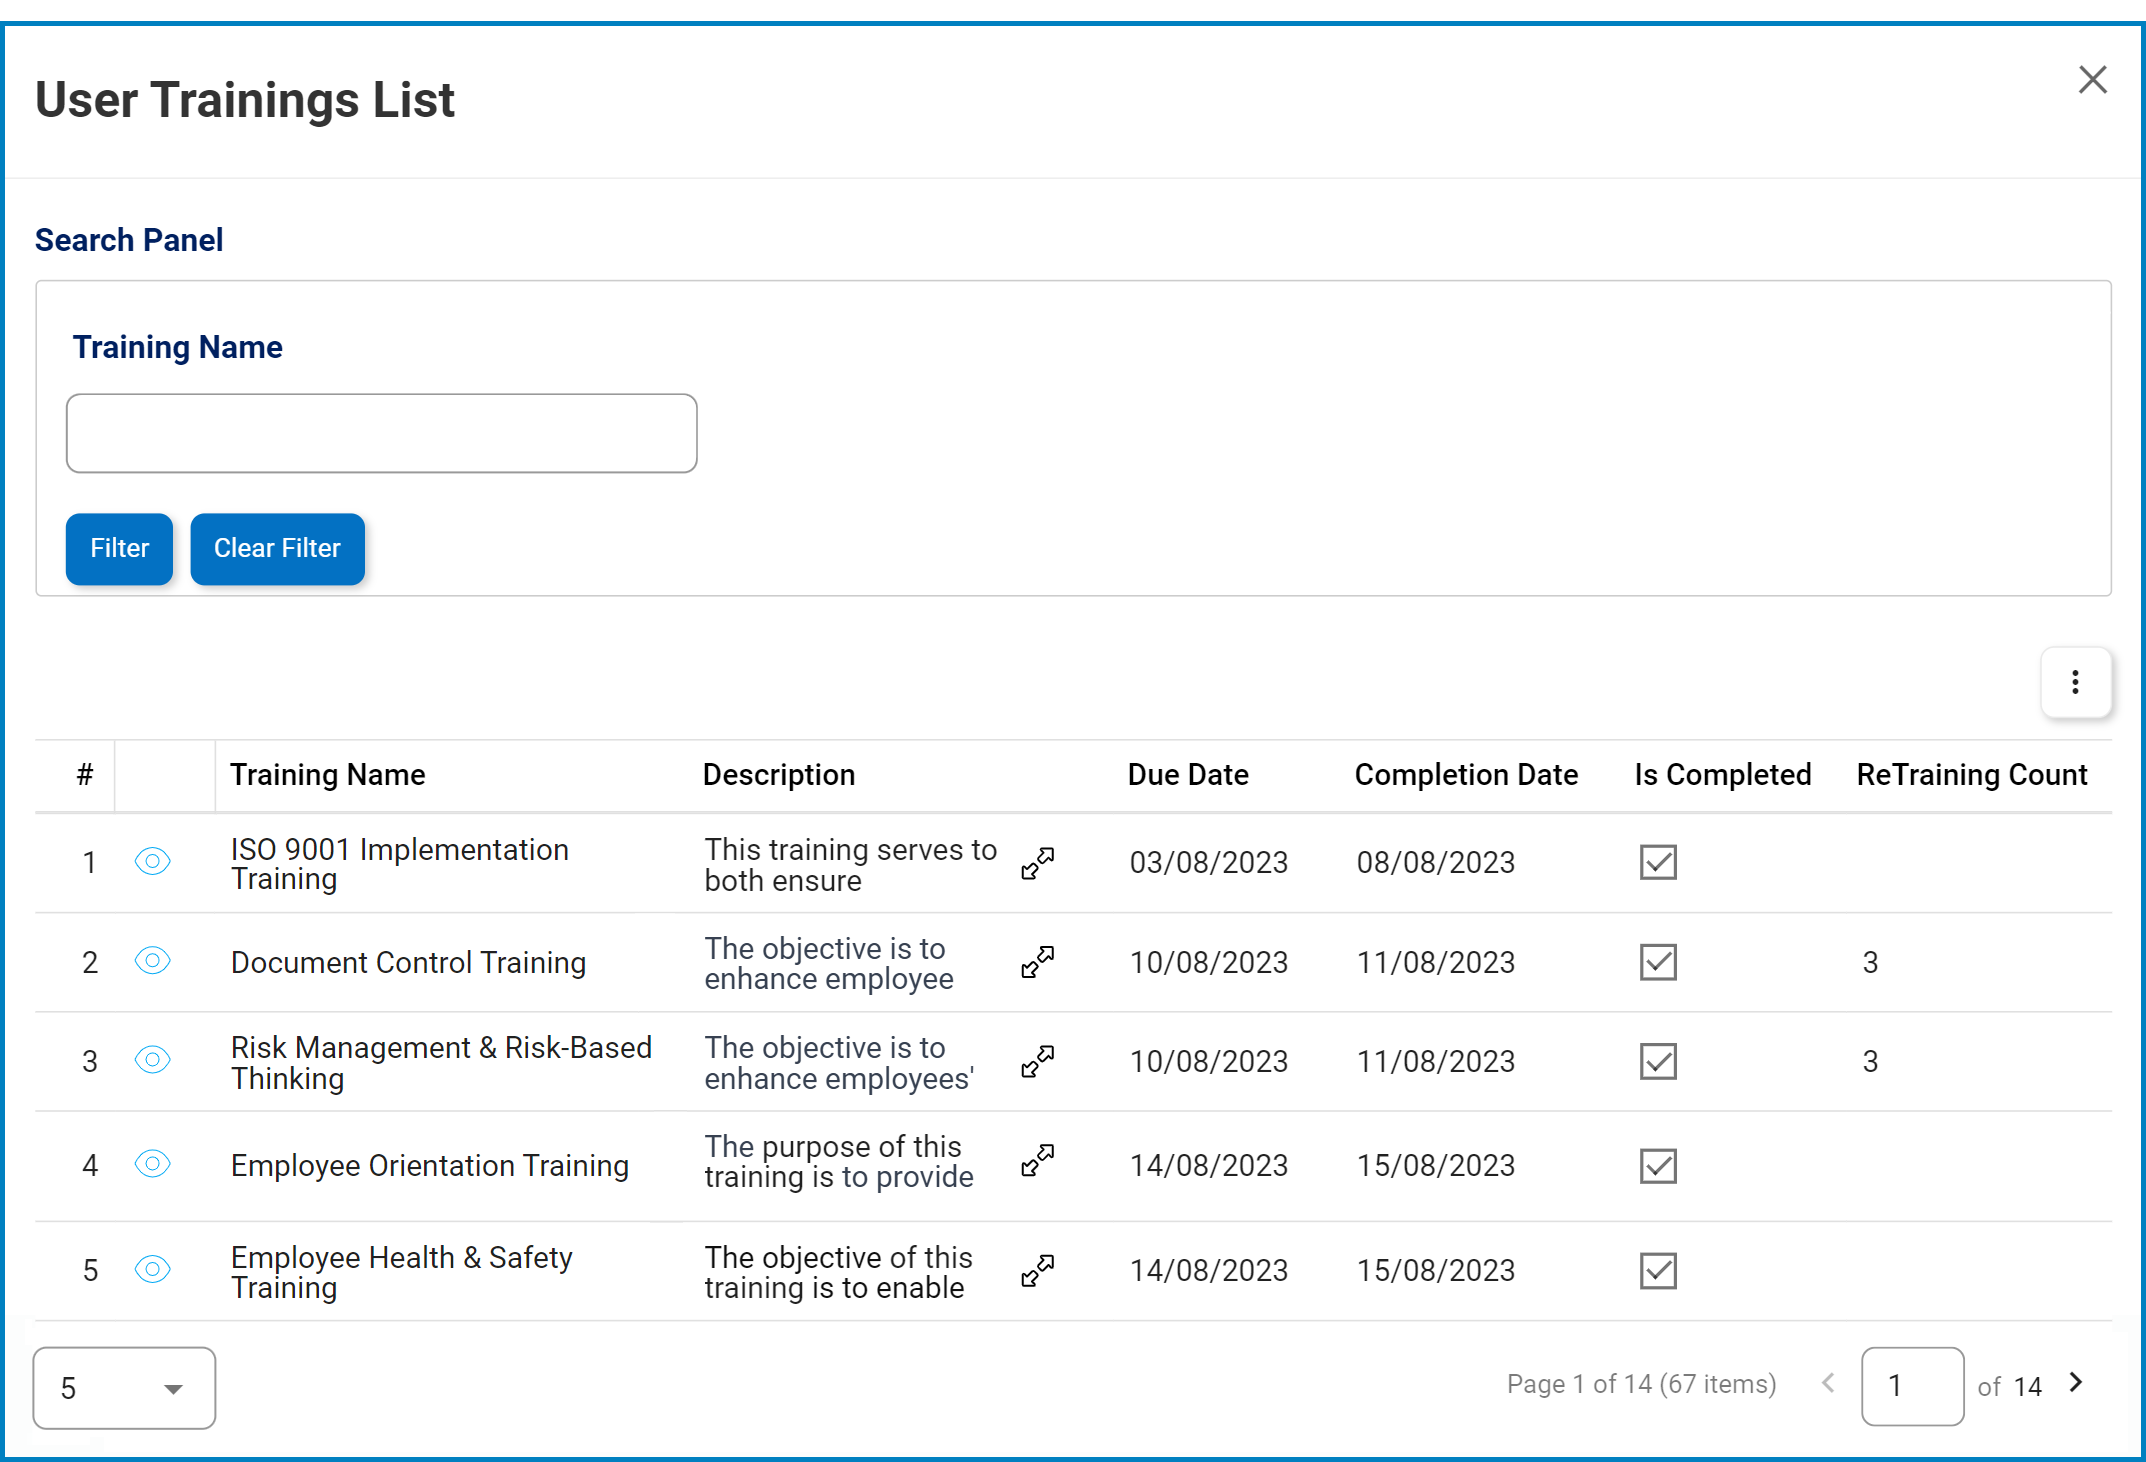
- For example, double-clicking the sector representing trainings that were completed past their due date reveals the following modal window:
![]()
- For example, double-clicking the sector representing trainings that were completed past their due date reveals the following modal window:

Post your comment on this topic.