
Impact Graphs provide a visual representation of the upstream and downstream associations related to items in the EPC. In simple terms, Impact Graphs show users what items are associated to one another. Seeing the different associations within a terms allows users to better understand the complexity of certain business terms. These Impact Graphs can be used to educate business users.
Impact Graph
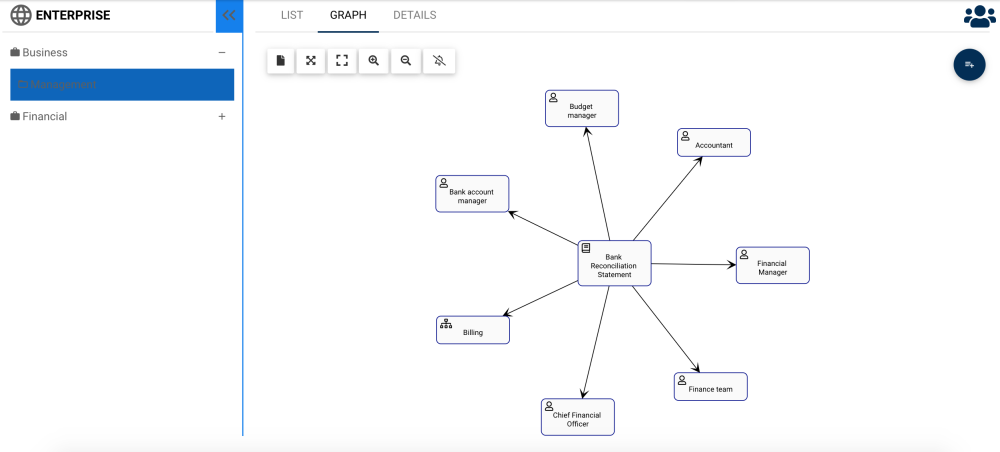
The specific nature of the items associated is denominated by the icon featured next to the name of the items.
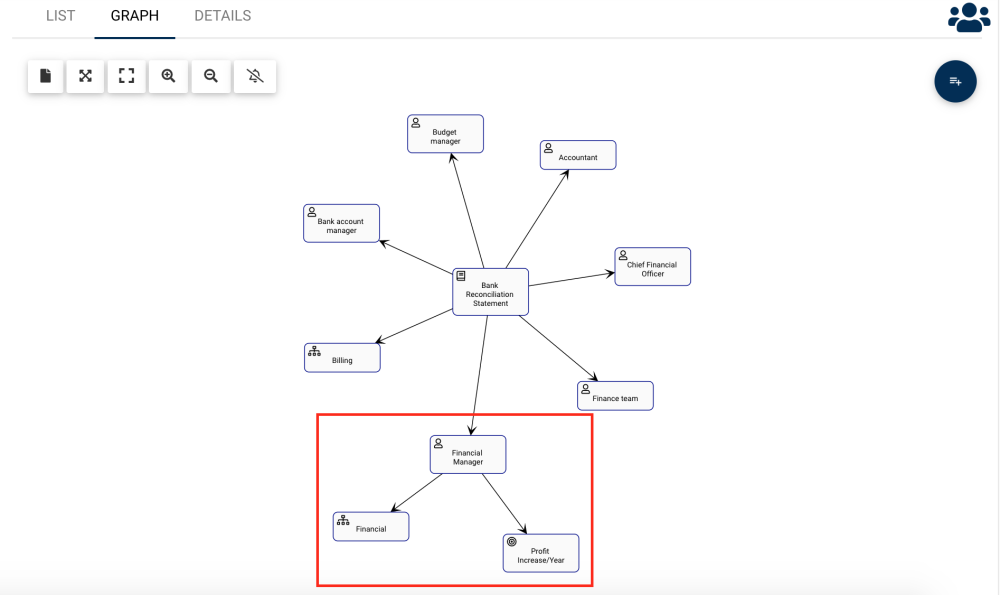
The Graph provides an initial visual representation of items that directly impact one another. Users can additionally expand the Impact Graphs to view indirect associations.
Users can double click on specific items within the Impact Graphs, which will display the associations to that item.
Impact Graph Navigation
To navigate to Impact Graphs, please see the following instructions.
1. Navigate to a Term within the Glossary Module
2. Click on the “Quick Graph View” icon 
3. By default, a user will be navigated to the Measures Hierarchy Graph. To view a specific item’s Impact Graph, a select the “Impact Graph” icon 
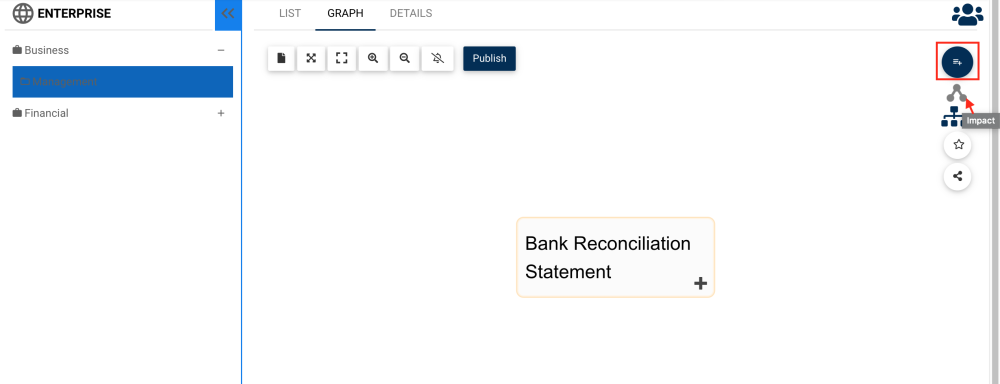
4. You will be navigated to the specific item’s Impact Graph
5. (Optional) To further expand the Impact Graph, simply double-click on the item to which you would like to display
Haben Sie noch weitere Fragen?
Visit the Support Portal