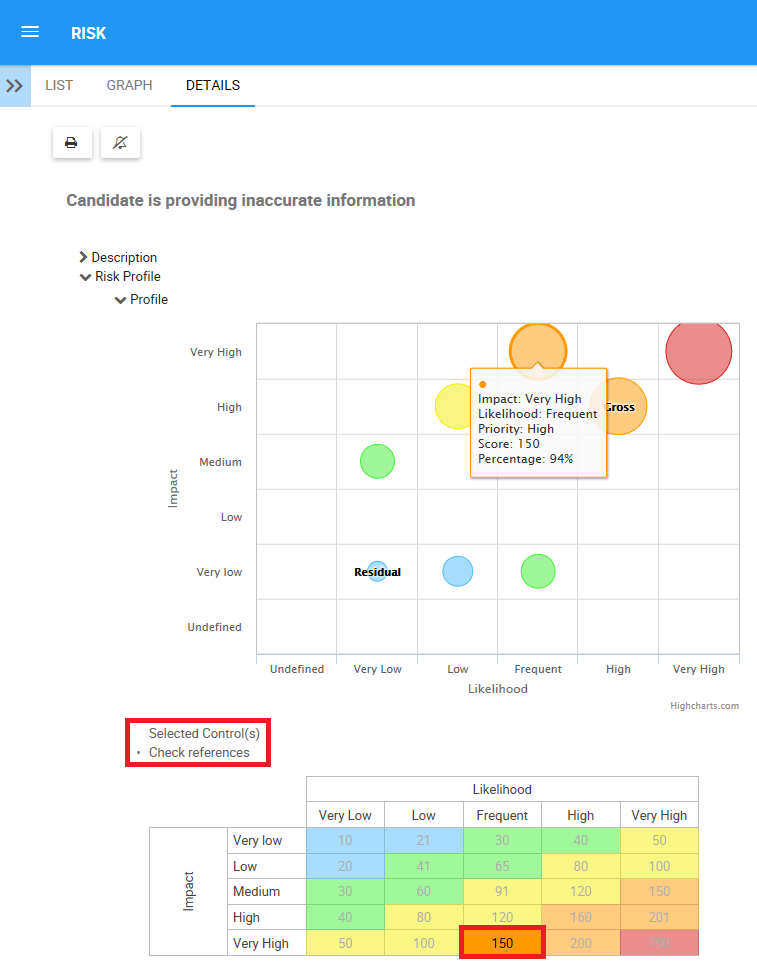
The Risk Profile graph is an interactive map that allows users to get a comprehensive view on a risk and controls applied. The Risk Profile graph is located under the Details section for a graph. The Risk Profile section displays two subsections, one called “Profile” and the other one “Analysis Justification.”
The Profile subsection displays on a graph the Gross Risk score, the Residual Risk score, and all the controls. Under the graph users can find an Impact and Likelihood Risk Matrix. The score highlighted on the Risk Matrix is the Residual Risk score.

The Risk Profile graph allows users to visualize and analyze how a Risk should be managed. On the graph, risks and controls are displayed with nodes along two dimensions. By clicking on the node, the user will obtain information concerning its type (Gross risk, residual risk, control), its impact, its likelihood, its priority, and its score.

When users select a risk or control on the Risk Profile graph, the selection will be displayed on the Risk Matrix highlighting its overall score, its impact, and its likelihood. When a control is selected, the control’s name will be displayed on top of the Risk Matrix. The score given is calculated depending on which priority is given by the modeler for the impact and likelihood of the risk or control. The Gross risk score is defined by the modeler, and the residual risk score is generated after the controls are applied. When there are no controls to a risk, the gross score is equal to the residual score.

The Analysis Justification subsection displays a information about the Risk Profile inputted by the Modeler.
Haben Sie noch weitere Fragen?
Visit the Support Portal


