
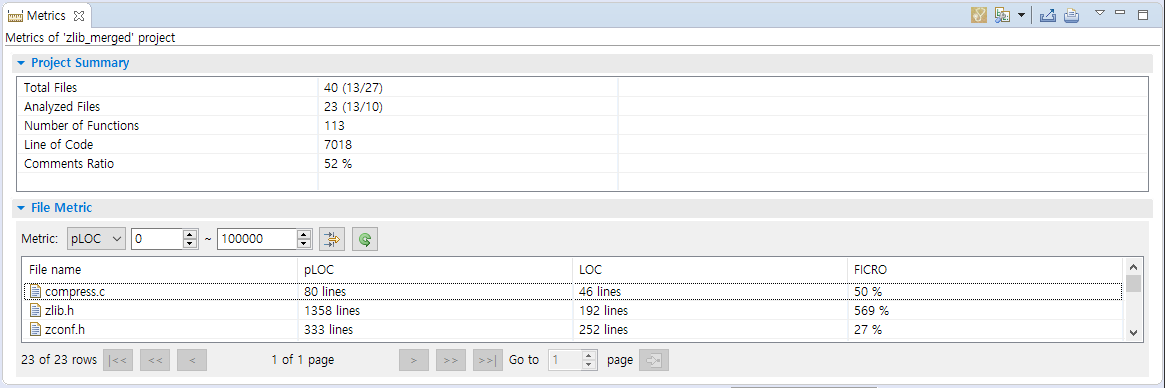
The Metrics view shows the result that measures the metric for the project. It shows the summary information for the overall metric and the metric information for each items included in the project (module, file, class, function).
Icons
| Icon | Description |
|---|---|
| Module (a logical portion that divides the project for each function) | |
| File (Source file and header file belonging to the project) | |
| Class | |
| Function |
Toolbar menu
| Menu | Description |
|---|---|
| |
Displays a diagnostic image of the value in the left of the metric value. |
| |
Changes the view mode ( |
| |
Exports the contents of view as a report. |
| |
Prints the contents of view. |
Pull-down menu
| Menu | Description |
|---|---|
| Sort by | Sorts based on the selected item (even if clicking the column name in the table, it is sorted equally). |
| Columns | Changes the order and width of the columns (allows you to change the order by dragging and dropping the table’s column name). |
| Configure diagnosis | Opens the diagnostics preferences page (allows you to set the diagnostic step and the ranges or images for each metric). |
| Set to Hide/Show metric | Sets whether to hide or show the metrics. |
| Metric View Option | Sets the number of lines per page in the Metric view. |
Filtering
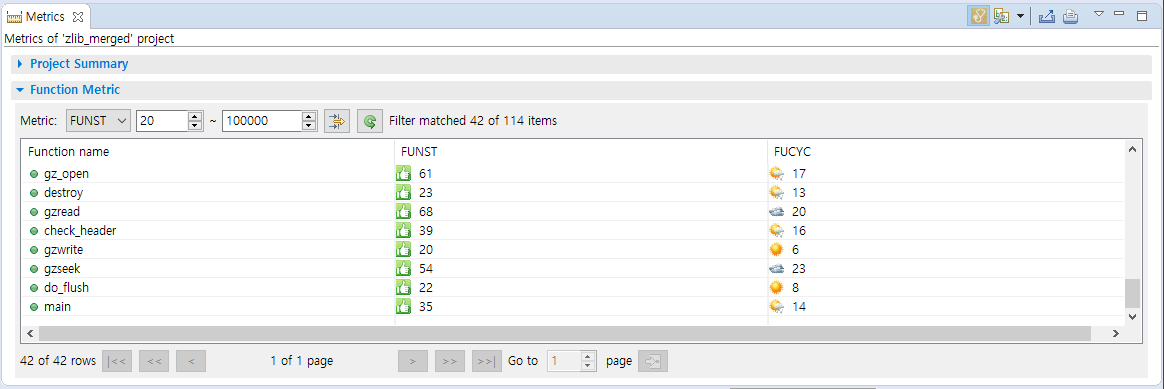
The filtering allows you to view only those items within the desired range for the specific metric.
Select a metric, enter the range value and click [Filtering] button in the right section to see those values corresponding to the entered information.
If you want to return to the status before filtering, click [Initialize the Filtering Criteria] button on the right side of [Filtering] button.
Paging
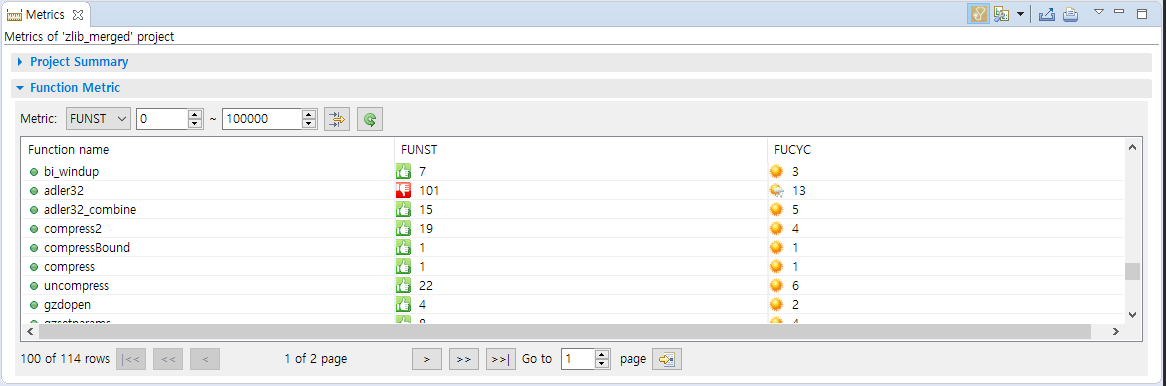
The Paging allows you to view many items conveniently.
Need more help with this?
Don’t hesitate to contact us here.