
The debug information view shows information to help you determine the cause of an error in a test case.
- Trace function calls in test cases with errors
- Actual value of variable/expression added to inspect debug information
If you select a test case that has [Inspect Debug Info] in the unit test view, debug information is displayed in the Debug Information view.
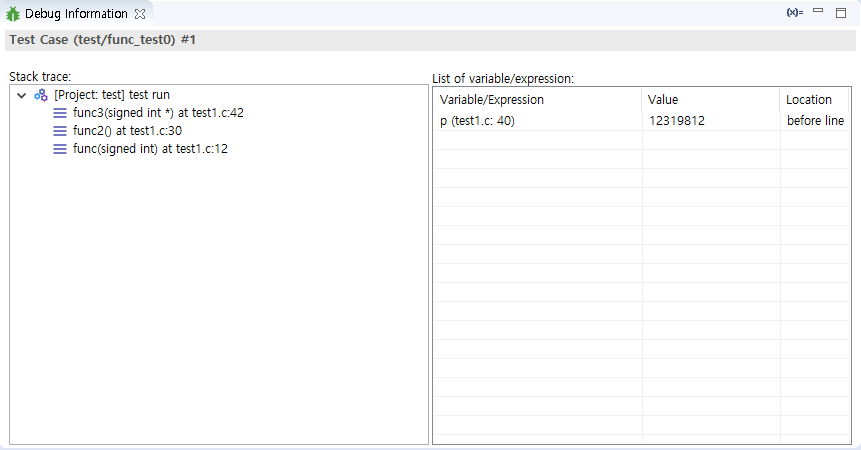
- The Stack trace shows the function call trace when the test case in error was executed. The location where the error occurred is displayed at the top.
- The variable/expression list shows the actual value of the variable/expression added to inspect the debug information.
Debug Information View toolbar menu
| icon | description |
|---|---|
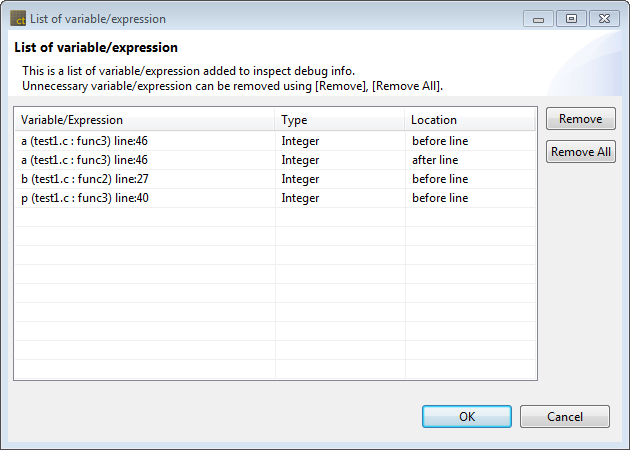
| List of variable/expression to debug |
In the list of debug variable/expression, you can check and remove variable/expression.
Adding variable/expression to debug
You can add variable/expression to debug in the following ways.
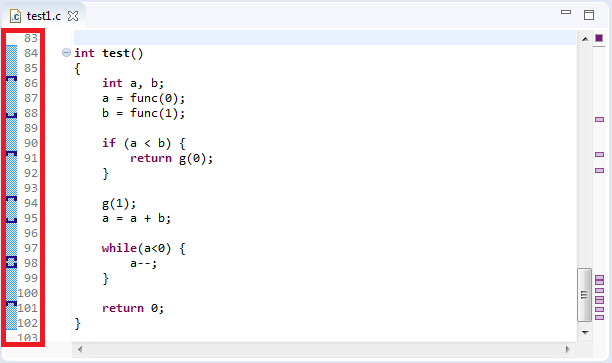
- Double-click the line area in the source code editor
- Select [Add Variable/expression to debug…] from the line area context menu in the source code editor
- After specifying a variable or expression in the source code editor, select [Add Variable/expression to debug…] from the context menu.
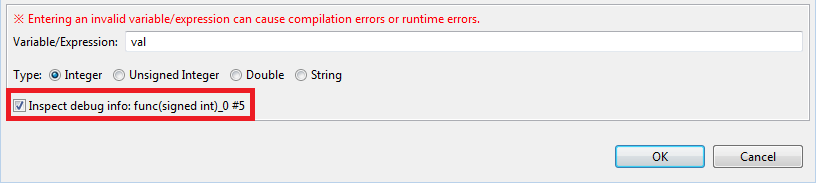
When the above operation is performed, the [Add variable/expression to debug] window appears.
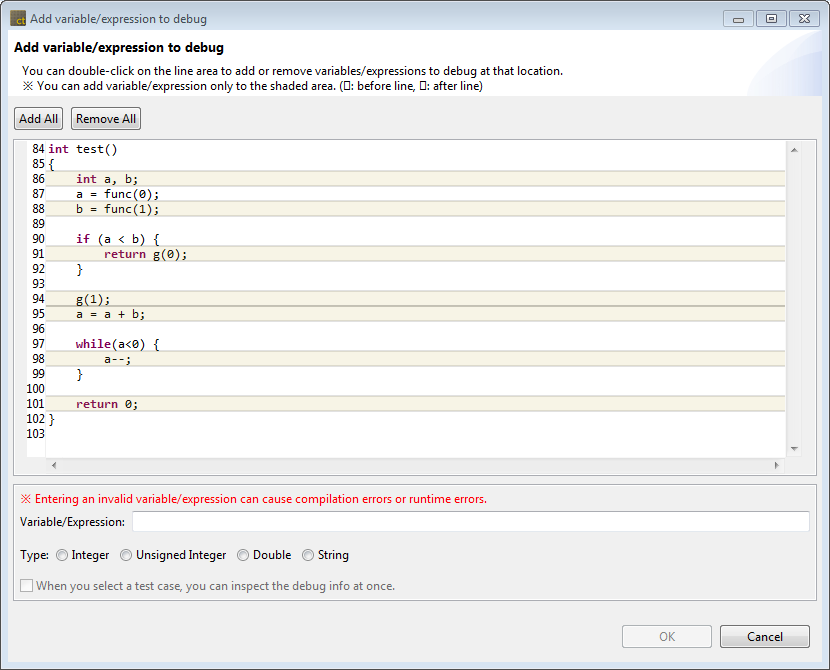
You can double-click on the line area to add or remove variable/expression to debug at that location.
| marker | description |
|---|---|
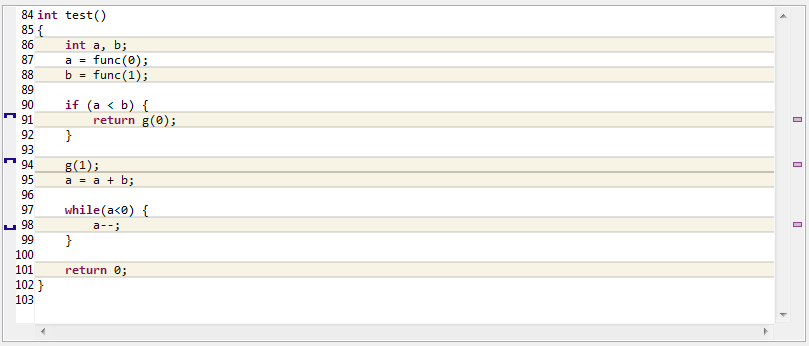
| Variable/expression added before the line | |
| Variable/expression added after the line |
You can add markers only in the shaded area.
If you can add a variable/expression to debug both before and after the line in the shaded area, a dialog will pop up asking where to add it.

You can add or remove variables/expressions anywhere you can add to the target function through the [Add All], [Remove All] buttons at the top of the source viewer.
After specifying the variable/expression and type and clicking the [OK] button, you can see that the marker has been added to the source code editor.
If the test case is selected in [Unit Test View], you can immediately perform [Inspect Debug Info] while adding a variable/expression to be debug.
Need more help with this?
Don’t hesitate to contact us here.