
它以百分比的形式显示测试运行后待测函数的覆盖率。
CT 2024.12中提供的覆盖类型
| 覆盖范围 | 说明 |
|---|---|
| Statement | 测试执行的源代码语句的百分比 |
| Branch | 测试执行的分支百分比 100% 分支覆盖率包括 100% 决策覆盖率和 100% 语句覆盖率 |
| MC/DC | 复杂考虑条件覆盖率和决策覆盖率的覆盖率(在 MC/DC 视图中描述) |
| Function call | 测试在所有函数中调用函数的百分比 |
| Function | 在所有函数中至少被调用过一次的函数百分比 |
覆盖视图中的标签图标
| 图标 | 说明 |
|---|---|
| 函数已更改 | |
| 包含 Asm 代码的函数 |
覆盖视图中的工具栏菜单
| 工具栏菜单 | 说明 |
|---|---|
| 显示每个测试的覆盖率 | |
| 显示全部覆盖率 | |
| 显示全部覆盖范围(包括外部覆盖范围) | |
| Properties | 打开属性页面 |
显示覆盖率
您可以在覆盖率视图或源代码编辑器中检查测试的覆盖率。
在覆盖率视图中显示覆盖率
覆盖率视图显示单元测试视图和集成测试视图中所选测试或测试用例的覆盖率信息。如果点击 [Show full coverage],则可以通过合并所有测试来检查覆盖率信息。如果点击[Show full coverage (Include External Coverage)],则还会显示通过合并从外部导入的覆盖率。
在树形图中选中的项目的覆盖率会显示在覆盖率视图的底部。

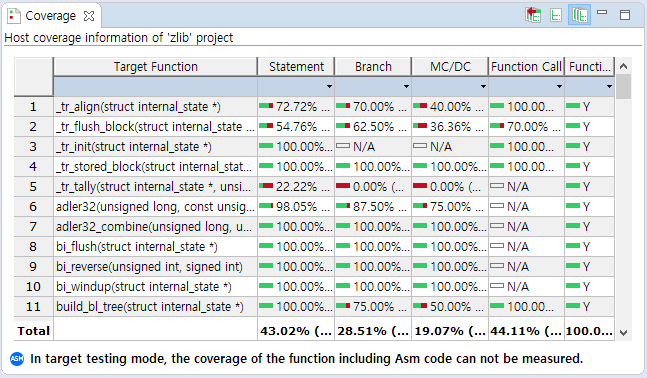
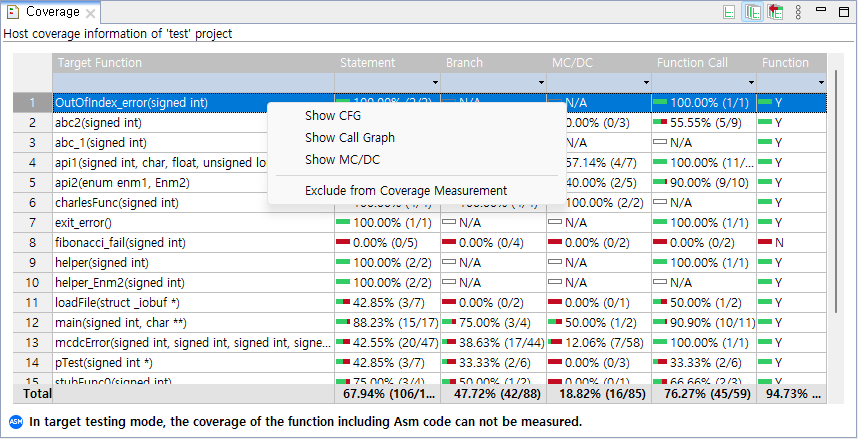
In the Coverage View, the coverage for each function is displayed for the items selected in the Unit or Integration Test View.
img-cvrg-view
In the Coverage View table, you can the control flow graph, the function call graph and MC/DC for each function via the context menu.
Through the [Exclude from Coverage Measurement] context menu, one or multiple functions can be excluded from coverage measurement.
Show coverage in the Source Code Editor
If you enable [ ![]() Show Coverage] icon in the main toolbar and click the wanted function/test/test case in the Unit/Integration Test View, it shows which part of the source code is covered by using the color information. The green color indicates that the code is covered, the red color indicates that the code is not covered, and yellow color indicates that the portion of the code is covered only.
Show Coverage] icon in the main toolbar and click the wanted function/test/test case in the Unit/Integration Test View, it shows which part of the source code is covered by using the color information. The green color indicates that the code is covered, the red color indicates that the code is not covered, and yellow color indicates that the portion of the code is covered only.
img-src-show-covered-area-3-6
In the vertical column on the left of the Source Code Editor, the marker indicate whether the branch statement is true or false.
| Marker | Description |
|---|---|
| icon-true-covered | The branch is only covered as true. |
| icon-false-covered | The branch is only covered as false. |
| icon-fully-covered | The branches are all covered. |
| icon-not-covered | The branch is not covered. |
| icon-partly-covered-multiple | A line with multiple branches partially covered. |
Need more help with this?
Don’t hesitate to contact us here.