In this step, the yield of products from the Index Primer PCR Reaction—the Amplified NGS Indexed Libraries of transcripts from each sample—are measured and then pooled in equimolar amounts for sequencing.
Quantify the Amplified Indexed Libraries
- Analyze the Amplified NGS Indexed Libraries using one of the following methods:
- Analyze 1 µl of each of the Amplified Indexed Libraries on either an Agilent Bioanalyzer with the Agilent High Sensitivity DNA Kit (Cat.# 5067-4626) or Agilent Fragment Analyzer using the Agilent High Sensitivity NGS Analysis Kit (Cat.# DNF-473-1000) using the manufacturer’s protocol.
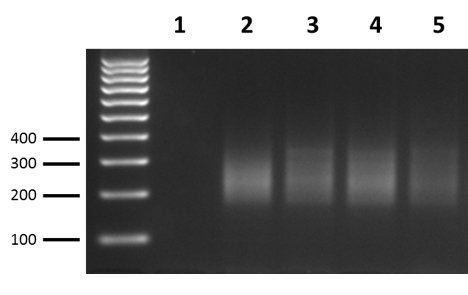
- Separate 5 μl of Amplified Indexed Libraries on a 3% agarose-TAE gel and analyze size distribution of NGS probes by UV transilluminator. The smear should be in the 180-450 bp range. See below for expected results of amplified libraries generated from good quality RNA samples.
- Analyze 1 µl of each of the Amplified Indexed Libraries on either an Agilent Bioanalyzer with the Agilent High Sensitivity DNA Kit (Cat.# 5067-4626) or Agilent Fragment Analyzer using the Agilent High Sensitivity NGS Analysis Kit (Cat.# DNF-473-1000) using the manufacturer’s protocol.
- Quantify the PCR products present in the size range of 180-450 bp by using image analysis software (available with most imaging systems) to subtract the background density of the negative control sample from the density of the PCR smears on the gel, or by using the software on the Agilent Bioanalyzer or Agilent Fragment Analyzer.
- The yields of the Amplified Indexed Libraries from the experimental RNA samples should all be roughly the same within 2-3 fold levels, and should be similar to the Positive Control RNA sample. If a majority or all of the experimental RNA samples have significantly less PCR product than the Positive Control RNA sample (i.e., >5-10-fold difference), you can return all of the experimental RNA samples and the Negative Control sample to the thermal cycler (see Note below) and run them for 2-3 additional cycles. After cycling, quantify the products again relative to the Positive Control RNA. This should not need to be done more than once, and more than 3 additional cycles is not recommended.
Note: Cycle all RNA samples together. Adjustments for small differences in the yield between samples will be made when the samples are combined for the sequencing step following this quantification procedure. Do not include the Positive Control RNA sample in additional cycles. Remove the positive control sample from the plate and keep it as a reference to assess the quantity of your PCR samples.
Remove Excess PCR Primers and Combine Samples
- Remove excess primers from the completed PCR reactions by adding 2 µl of Primer Removal Master Mix (prepared in the Forward Gene-Specific Primer Extension step) to each of the Amplified Indexed Libraries and the Negative Control sample, then incubate at 37°C for 30 minutes.
- To ensure accurate quantification for sequencing, you should repeat the quantification procedure of the Amplified Indexed Libraries and the Positive Control RNA again. Quantifying PCR products after removal of PCR primers is more accurate than analysis before clean up.
- After primer removal and re-quantification, use the yield assessment of the Amplified Libraries in the PCR with Indexed Primers step as a basis to combine equimolar amounts of each of the Amplified Index Libraries, including the positive control RNA, into a single pool for NGS. For example, if the 180-400 bp amount of Library 1 is twice that of Library 2, then mix 5 µl of Library 1 with 10 µl of Library 2 for a 1:2 ratio. The number of pools and number of samples combined into each pool should be determined based on which samples will be run together in the same lane or flow cell for sequencing. To minimize sample-to-sample sequencing variations, combine and load similar numbers of samples onto each flow cell.
For the Genome-Wide DriverMap Assay (which targets 19,000 genes), refer to the table below for guidelines on how many samples may be combined together for different instruments and read depths. For less complex DriverMap Targeted Kits targeting fewer genes, the number of samples per flow cell can be increased. Generally, you should aim for 500-1000 reads per gene target. For example, for or a DriverMap Assay targeting 4,000 genes, 2-4 million reads per sample (i.e., 4,000 genes times 500 reads to 1,000 reads) is adequate.
| Instrument | Reads per flow cell | Number of samples for multiplexing per flow cell |
Reads per gene |
|---|---|---|---|
| MiSeq Series | 25 million | 5 | 5M reads/sample or 500 reads/gene average |
| NextSeq Series | 400 million | 48 | 8M reads/sample or 1000 reads/gene average |
| HiSeq Series | 2 billion, 8 lanes | 192 (96 per lane, 2 lanes) | 10M reads/sample or 1000 reads/gene average |
Need more help with this?
Contact Us


