
Determine the amount of Spike-In Mix to add.
For typical AIR-RNA assay protocols using 25-100 ng of total RNA for optimal clonotype detection of lymphocyte-rich samples, like whole blood, PBMC, lymphoid tissues, or isolated immune cells, we recommend spiking in 2 µl of TCR/BCR control mix (or control from TCR/BCR set) in a 20 µl AIR-RNA hybridization reaction mix (step 1, AIR protocol). Under these conditions, you could expect that the AIR-RNA profiling assay will detect approximately 100 to 1,600 spike-in cDNA molecules for different control constructs present in the AIR Spike-In Control mix.
If you use less than 25-100 ng of RNA in your AIR assay, reduce the spike-in control constructs to 0.2-0.5 µl. To avoid adding small volumes, dilute the Spike-In Controls in the provided dilution buffer. Some assays, such as those of lymphocyte-deficient samples (e.g., non-lymphoid tissues or cancer samples), often require more than 100 ng of total RNA. The optimal amount of TCR/BCR control of spiking into RNA samples with a low number of lymphocyte cells needs to be adjusted in proportion based on the approximate content of lymphocytes as compared to more typical samples, such as PBMC samples.
In general, the maximum number of spike-in control molecules should be significantly less than the number of TCR/BCR molecules in the sample (e.g., below 20%), and the number of molecules of the most abundant clonotypes (e.g., below 10,000 mRNA molecules). The minimum number of spike-in molecules for any construct should be enough to be measured in the AIR assay, e.g., more than 10-20 spike-in mRNA molecules. The complexity and diversity of TCR/BCR molecules significantly depend on the starting RNA amount used in the assay and the immune cell composition of experimental samples. To predict the appropriate Spike-in volume for your experimental samples, we recommend running an immune receptor profiling assay for a few pilot samples to measure the immune receptor template complexity and diversity for your experimental samples.
Table 1 below provides guidelines for the starting amount of RNA for AIR TCR-BCR profiling assay, expected complexity (similar to the number of TCR/BCR molecules), and recommended amount of spike-in controls:
| Sample Type | Optimal Input Amount | Measured Complexity of TCR/BCR molecules | Recommended Spike-in Mix Volume |
|---|---|---|---|
| Whole blood | 100 ng | 50-200K | 2 µl |
| PBMC | 50 ng | 50-200K | 2 µl |
| T/B Cell fractions | 10-25 ng | 10-20K | 2 µl |
| Lymphoid Tissue (fresh/frozen) | 100 ng | 50-200K | 2 µl |
| Cancer biopsies | 500 ng | 1-20K | 0.5 µl* |
| Non-lymphoid tissues | 1000 ng | 1-50K | 0.5 µl* |
| FFPE Tissue | 1000 ng | 0-5K | 0.5 µl* |
Use cases for AIR Control Mixes:
1. Assessing Assay Performance: To assess the linearity, dynamic range, and sensitivity (Fig 4) of the DriverMap AIR Assay or similar AIR-seq assays, we recommend adding 2 µl of either the AIR TCR or BCR Spike-In Control Mix. Depending on the specifics of your assay, you can add more or less amount of Control Mix to additional samples to extend the assay’s linear range, as shown in the table above. The quality of AIR profiling data could be different for experiments performed in different batches. This can be investigated by high-complexity standard reference control samples (e.g., PBMC or spleen) spiked with synthetic AIR control mixes.
Spike-in of the control to just one experimental sample and positive control RNA sample may be sufficient for quantification of immune samples with similar lymphocyte content, such as RNA from PBMC or whole blood. We recommend including spike-in control in multiple samples for samples with different lymphocyte content (e.g., PBMC and tumor samples) or potentially different template quality (e.g., frozen and FFPE samples) to evaluate assay performance. Please refer to Table 1 (above) for detailed input volumes. If you aim to evaluate reproducibility, measurements should be done in replicates.
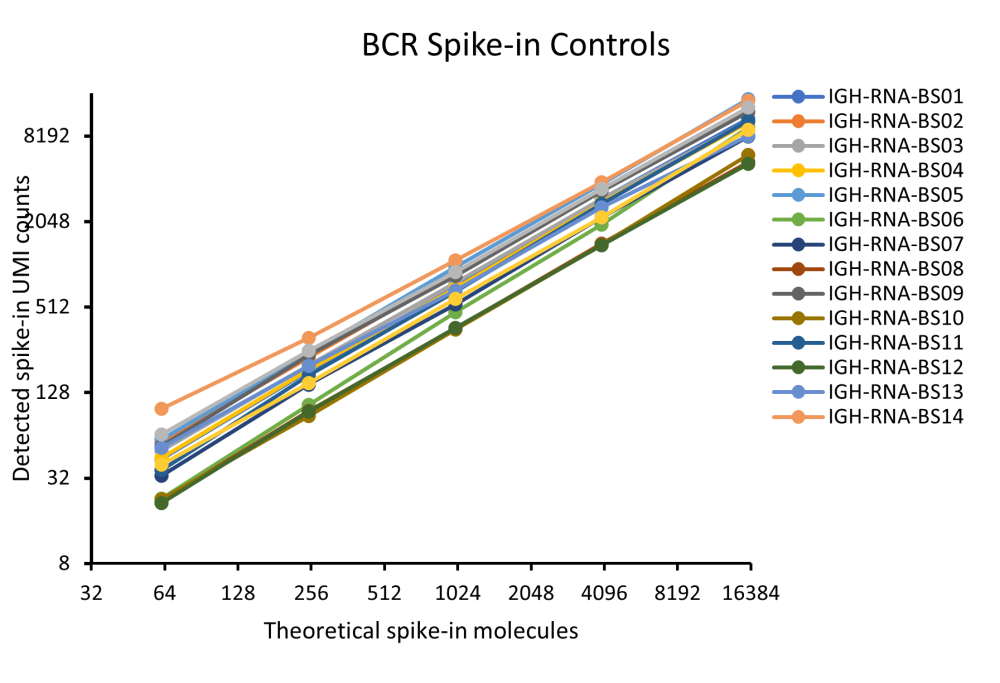
 Fig 4. illustrates the results of linearity and dynamic range of AIR-RNA assay in PBMC control RNA sample spiked in with Spike-in Control Mix at different input amounts. AIR-RNA CDR3 assay was performed in triplicates using 50 ng of positive control PBMC RNA spiked with 0.5, 2 or 8 µl of control RNA mixes. Amplified TCR/BCR CDR3 library was sequenced at depth of 20x10^6 reads per sample and analyzed by MiXCR software to calculate the number of detected molecules or each RNA in comparison with number of theoretical RNA molecules spiked in PBMC RNA.
 2. Measuring sequencing errors: Due to the enormous complexity and variability in TCR and BCR repertoire sequences, any biases generated in enzymatic, NGS, or data processing steps could significantly affect AIR profiling results. Using Spike-In Control Mixes with defined reference sequences is the best strategy to accurately measure sequence errors and evaluate mechanisms responsible for generating these errors. Data Analysis Section 8.4 describes the alignment of raw sequencing data to reference control sequences to accurately quantify error rate measurement. Importantly, Spike-In Control Mixes only allows measuring but can’t correct these sequencing errors. Cellecta’s DriverMap AIR-RNA assay incorporates eight Validator Barcodes (VBCs) in reverse primers at the reverse transcription or primer extension steps. VBCs similar to UMIs are designed to identify and correct amplification biases and sequencing errors for AIR RNA assay. The MiXCR software incorporates an efficient algorithm for VBC-based error correction by analyzing the distribution of reads per cDNA molecule ratio. However, errors introduced at reverse transcription or in the first PCR cycle cannot be corrected by VBC-based analysis, especially for rare clonotypes. However, these errors can be measured by spike-in control constructs, and this information can be used to validate the analysis of the detected actual complexity of immune receptor RNA molecules.
Need more help with this?
Contact Us