
The purpose of the results section is to communicate to the reader the data you collected in a clear and organized fashion. This section often includes tables and figures to help report the information.
This is the real central piece of your study that shows off the actual work and functionality of your tests/experiments. Remember, the sections before the results provided the reader with background information and defense for why these particular data sets are important, significant and worthwhile. Thus the results section should fulfill your original purpose of the report. Does it fulfill your original hypothesis/purpose?
A common mistake made by students is to merely present tables and figures in this section. This is not sufficient; your results should be written in prose, and supported by the tables and figures.
Below are some key points to presenting the results in a clear organized manner that is self-sufficient and significant.
- Begin by organizing the order of information; if your methods/procedure is in a particular order present your results in the same manner. Either way your results should tell a story which is easy to follow and logical in flow.
- Your text should state significant findings, and summarize the data. Compare these examples:

- Think of your reader as someone who was not in the lab when you performed the experiment. This will force you to include the small details which you would assume otherwise.
- Ensure your report is well laid out and organized. (i.e. tables and figures should be on the same page as their titles and legends; page numbers should be included; etc.) Your reader should not have to search around for things.
- Do not duplicate data in a paragraph, table or figure; sometimes a paragraph is sufficient and best to present data such as a statistical test or confidence limits.
e.g. The standard t-test (4.56) was higher than the t-crit (2.09), therefore at the 95% confidence interval, there is a significant difference between snap pea and snow pea respiration rates.
Tables and figures should be self-sufficient in that they contain all the necessary information to understand the data rather than forcing the reader to hunt through the methods in order to know what is being presented. All figures and tables should have descriptive titles and should include a legend explaining any symbols, abbreviations, or special methods used.
Creating Tables
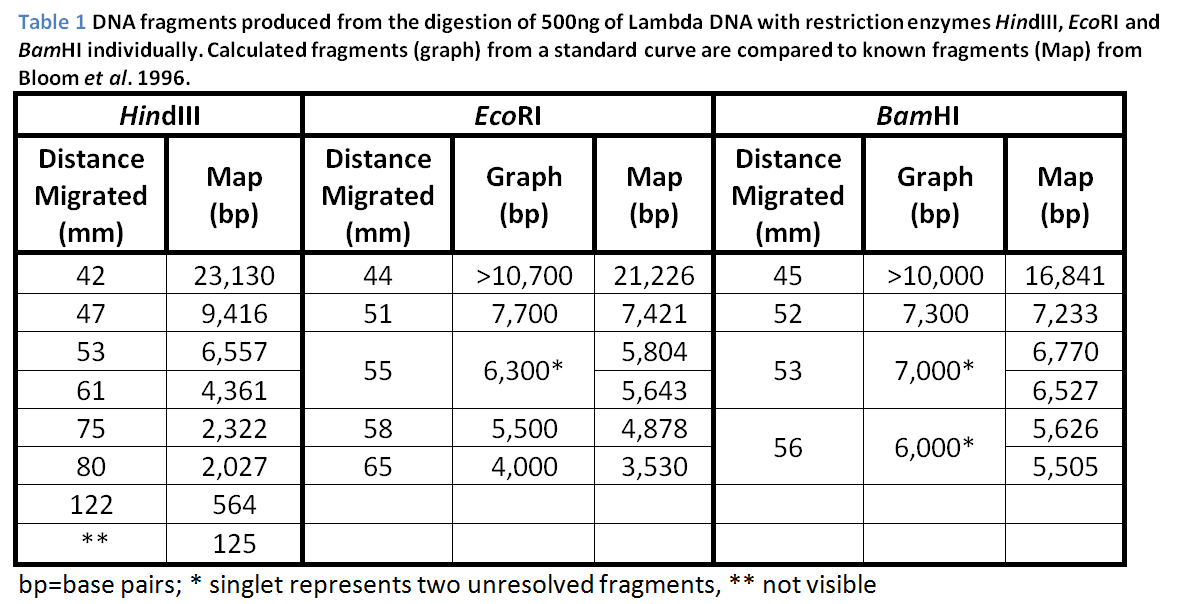
Tables allow you to present a considerable amount of information in a concise manner. Descriptive titles will always appear above the table. Tables or figures will always be presented on a single page: never split up the title and the table over two pages! See the following examples of appropriate table presentation:
Creating Figures
Anything that is not a table will be a figure. This includes: agarose gels, graphical trends, standard curves, graphs, maps, photos, drawings etc. The following examples demonstrate appropriate formatting for a variety of figures you will encounter in Biology:
Gels: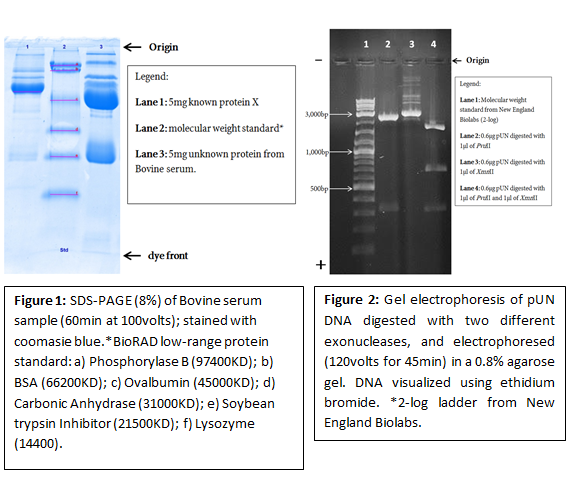
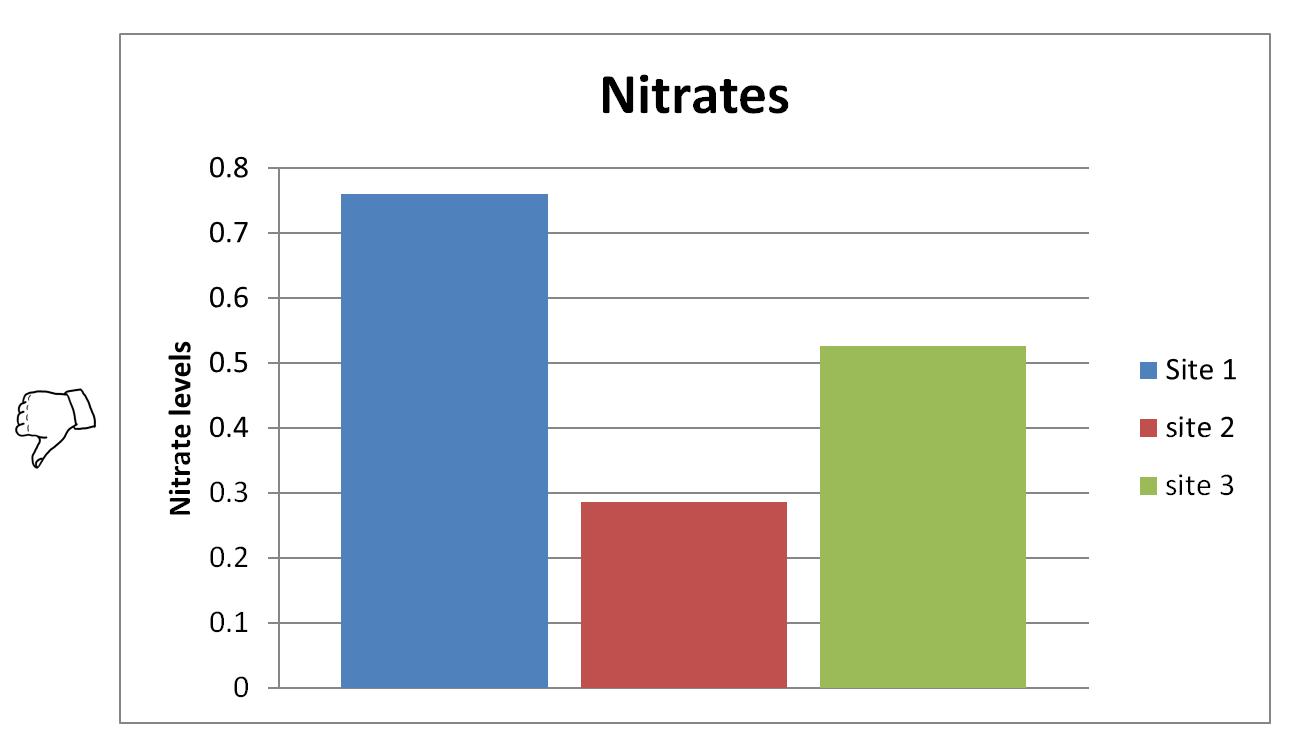
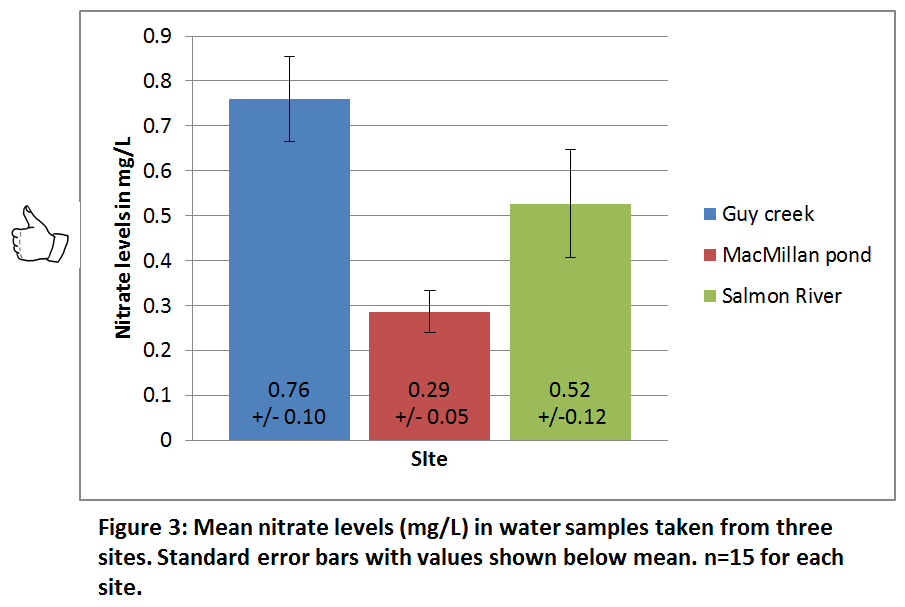
Graphs:
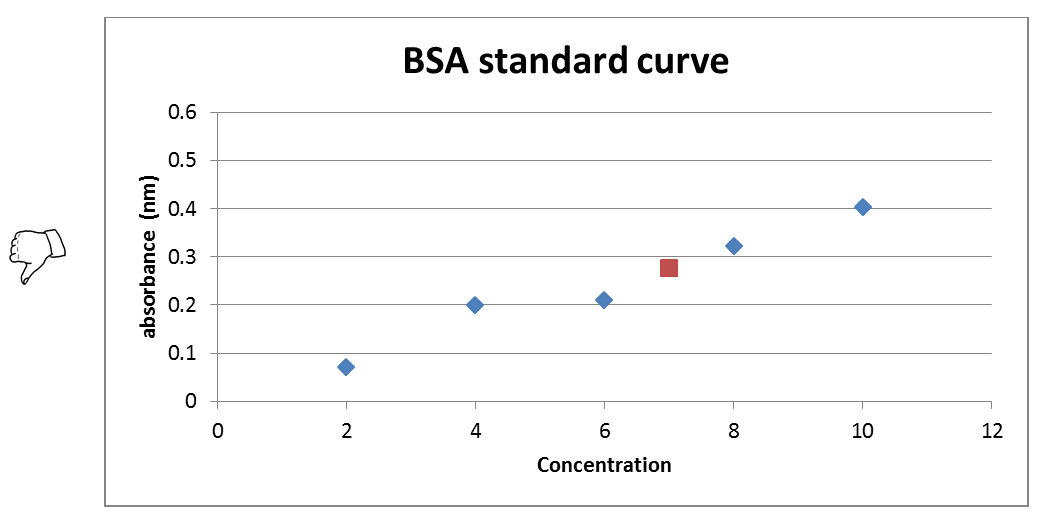
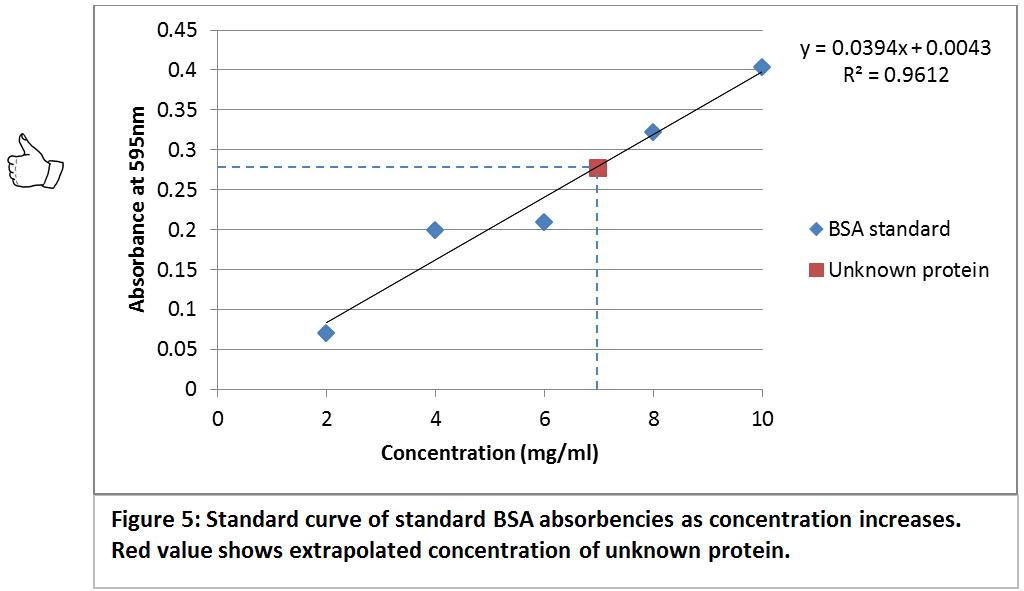
Standard curves:
Post your comment on this topic.