
The main screen of the web application is the statistics screen. It consists of a few different panels representing different views of your data.
Glucose overview
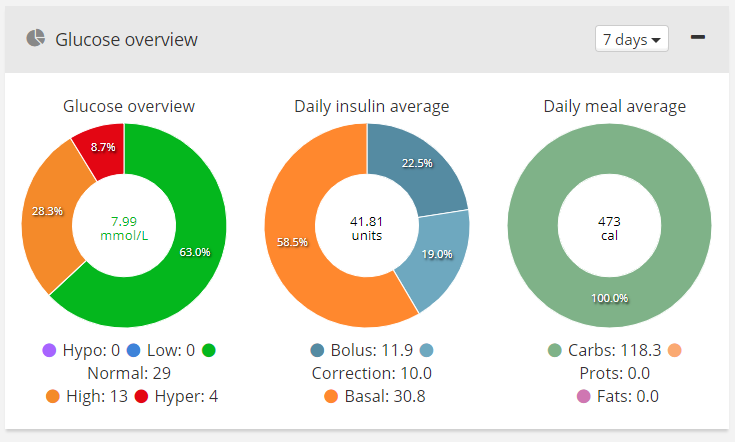
The glucose overview consists of 3 pie charts representing your glucose, insulin intakes and nutritions intake (carbs, protein, fats). The default period shown is 7 days, but can be changed from the top right corner of the panel.
Glucose overview – the pie chart representing the glucose overview shows the glucose distribution grouped by glucose levels – hypo, low, normal, high, hyper. Each group is presented with different colors shown under the pie chart with the respective count of entries for each group.
Daily insulin average – this pie chart shows the distribution of insulin for the selected period. The groups shown are bolus, basal and correction. Each group is represented with different colors shown under the pie chart with the respective units of insulin for each group.
Daily meal average – this pie charts shows the distribution of nutritions for the selected period. The groups are carbs, fats, protein. Each group is represented with different colors shown under the pie chart with the respective grams for each group.
Daily overview
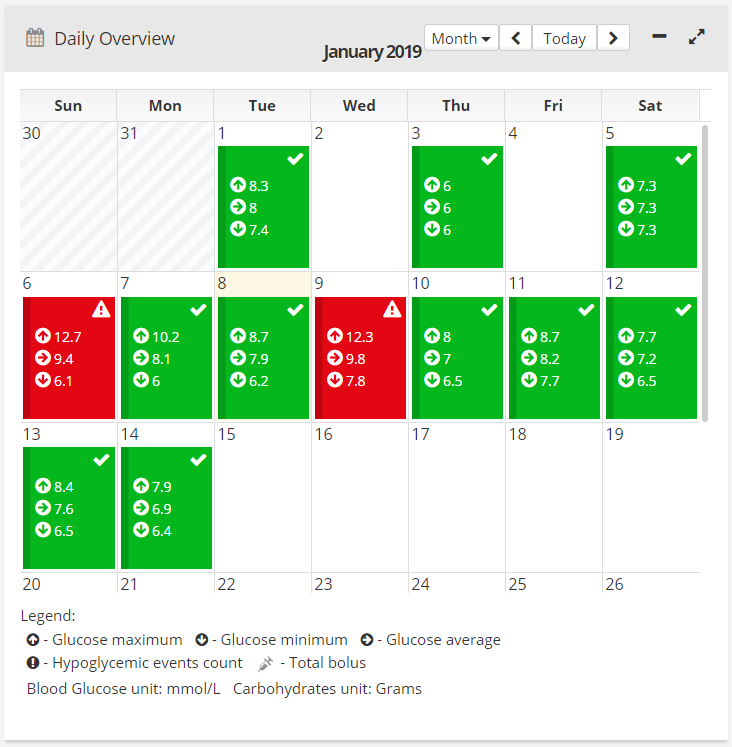
The daily overview panel shows a calendar of the selected month with the min/max/avg glucose levels for each day. The calendar can also show a more detailed weekly view with the same min/max/avg values for each day of a selected week or daily view which shows the values hour by hour.
The calendar also shows hypoglycemic events count and bolus insulin.
The days/hours are color coded by the events trough that day.
For the best experience you can expand this panel to a full screen view.
Statistics
Diabetes:M provides a lot of statistics in form of diagrams, graphs and charts. You can view your collected data visually and understand it better.
Main statistics
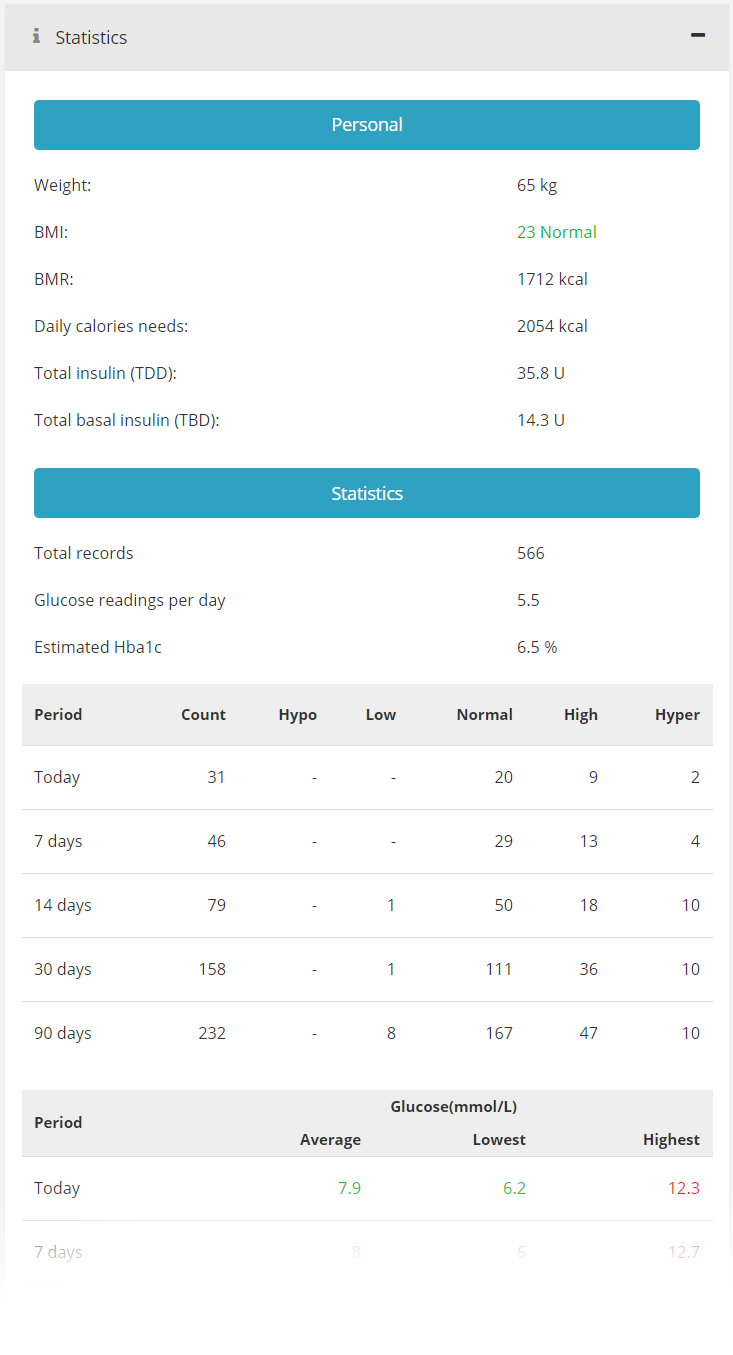
On the home screen there is a field called “Statistics”, it takes you to this screen which shows you some personal stats and the statistics for the last 7/14/30/90 days.
The summary sections displays the most important statistics which are calculated using the user’s settings and the data in the entries database.
Personal
- Weight
- *Body Mass Index (BMI) * – based by your weight and height this index indicates whether your measures are in normal limits or you are underweight or overweight
- Basal Metabolic Rate (BMR) – BMR represents the number of calories you need to maintain your weight if you are sedentary. It is based by your weight, height, age and sex.
- Daily Calorie Needs – usualy you need mor calories per day than your BMR index. Daily Calorie Needs is based by your BMR and your daily activity.
- Total Insulin – the total daily amount of insulin based by the body weight and bolus insulin type (rapid or regular)
- Total Basal Insulin
- *Carbohydrate Ratio * – represents how many grams of carbohydrates are covered by 1 unit of insulin. Based by body weight and bolus insulin type (rapid or regular)
- Insulin Sensitivity – represents how much the blood glucose will be lowered when apply 1 unit of insulin. Based by body weight and bolus insulin type (rapid or regular)
Period average statistics
- Main statistics
- Total records – total records count in the database
- Average glucose readings per day – displays how many records with blood glucose value are entered in the database
- Estimated HbA1c – HbA1c value based by the blood glucose readings for the last 90 days. Requires minimum of 9 glucose readings to calculate the estimation of HbA1c value.
- Table with the glucose reading counts for the current day and the last 7, 14, 30 and 90 days grouped by hypoglycemia, low, normal, high and hyperglycemia blood glucose values.
- Table with the averages for glucose readings for the current day and the last 7, 14, 30 and 90 days. Also displays the lowest and highest value for the time period.
- Table with carbohydrates and insulin daily totals for the current day and the last 7, 14, 30 and 90 days. Also displays the ratio between bolus and basal insulin daily intake.
- Table with weight for the current day and the last 7, 14, 30 and 90 days and the change between
- Table with sleep and activity data – if you have enabled the “Smart assistant”
- Table with the LBGI and HBGI risk indexes and glucose variability indicator. For details see Blood Glucose Indexes.
Other statistics
Diabetes:M provides a few types of data visualizations showing different variables from your data:
Graph – showing glucose levels and glucose infusion rate throughout the day with options to filter the data
Charts – display all the collected data in various types of reports with time configuration
Reports – prepare reports for some period, export it as XLS, HTML, PDF and save it or share it with your doctor.
Latest data
The latest data panel shows the latest entered values such as:
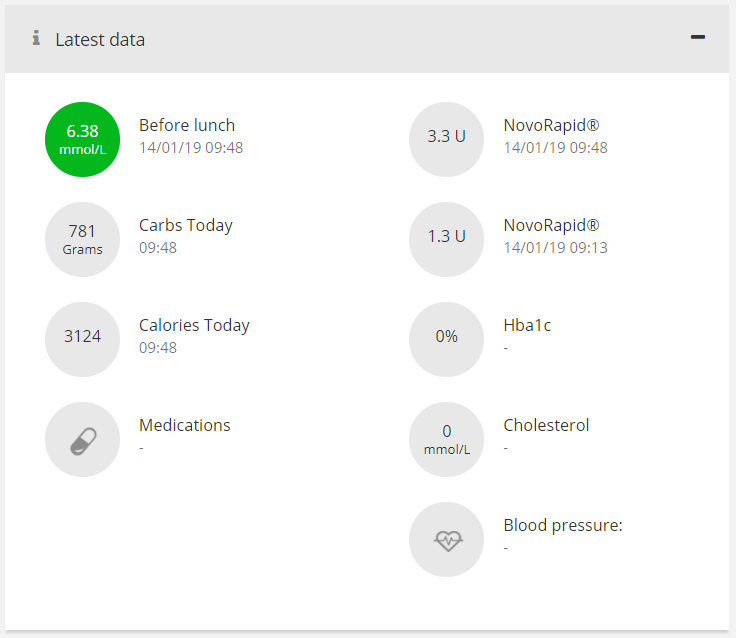
- Glucose
- Carbs
- Calories
- Medications
- Bolus insulin
- Basal insulin (or basal rate)
- HbA1c
- Cholesterol
- Blood pressure
Diabetes treatment overview
This panel shows various warnings about the diabetes treatment in the last few weeks.
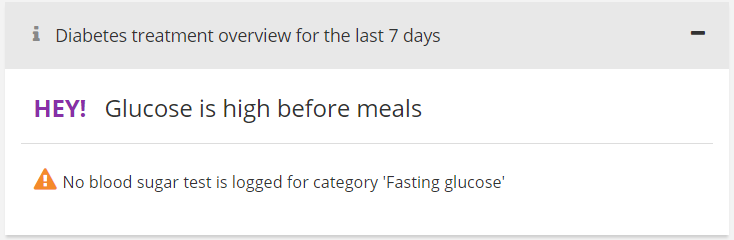
It notifies the user for missing entries in some categories, glucose variations, repeating events and other important data that the user should know about.
Need more help with this?
Don’t hesitate to contact us here.