
In this tab, users can access data pertaining to the Quality Event application.
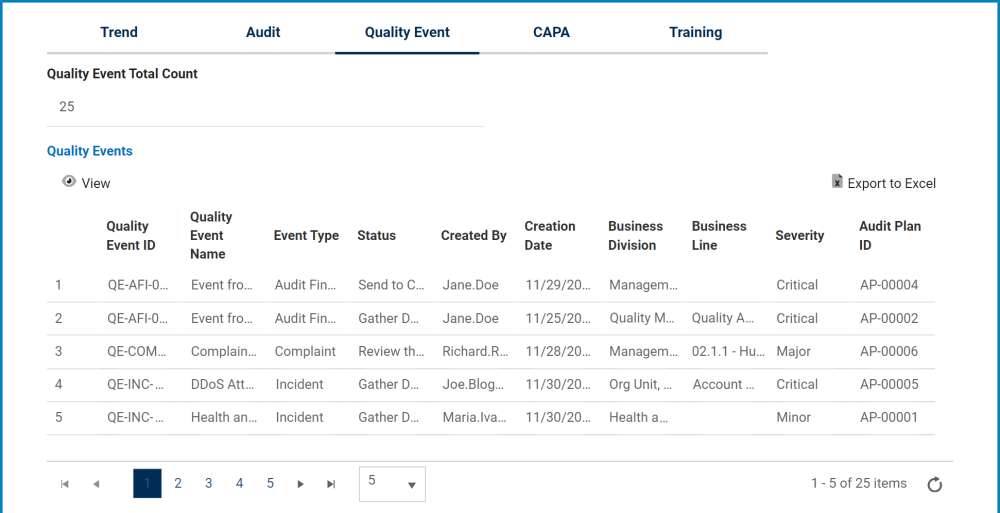

- Quality Event Total Count: This is a numeric field that automatically displays the total number of quality events. It can be modified.
- View: This button allows users to view a quality event.
- To view, select the desired audit plan from the grid and click on the View button. In viewing mode, users cannot make any modifications. They can, however, view details in supplemental forms, download any attached files, and access/download any available templates.
- For more details on templates, click here.
- To view, select the desired audit plan from the grid and click on the View button. In viewing mode, users cannot make any modifications. They can, however, view details in supplemental forms, download any attached files, and access/download any available templates.
- Export to Excel: This button allows users to export the grid to Excel.
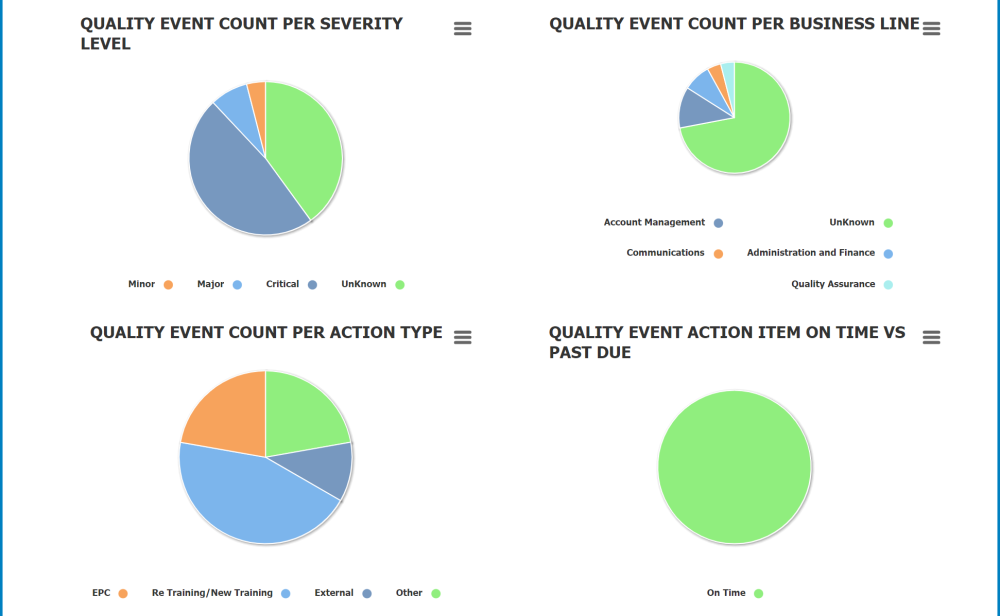
- Chart Context Menus: These are hamburger buttons which, when collapsed, display a list of options that allow users to either print or download the chart.
- For more details on this type of menu, click here.
- Quality Event Count: This is quantitative data that users can access by hovering their cursor over the different symbols in the chart. (Symbols, in this case, refers to the slices/sectors of the pie chart and the bars of the bar chart).
![]()
- Drilldown Reports: These are data reports that users can access by double-clicking on the different symbols in the chart. (Symbols, in this case, refers to the slices/sectors of the pie chart and the bars of the bar chart).
- For example, if users were to double-click on the sector representing quality events that have a minor severity level, a pop-up window would appear with the following form:
![]()
- All charts in this tab are equipped with a drilldown functionality. By double-clicking on a symbol in the chart, users are essentially drilling down data. They are moving from the summary report visualized by the graph to the detailed report that created it.
- For example, if users were to double-click on the sector representing quality events that have a minor severity level, a pop-up window would appear with the following form:
- Submit: This button allows users to submit the form.


Post your comment on this topic.