
The results of the Implausible Read Analysis program are available upon the completion of the main program. After you run the Node5 Architecture program on-line, you are able to monitor the status of the program whilst it executes by repeatedly selecting the “Refresh” button in the application toolbar.
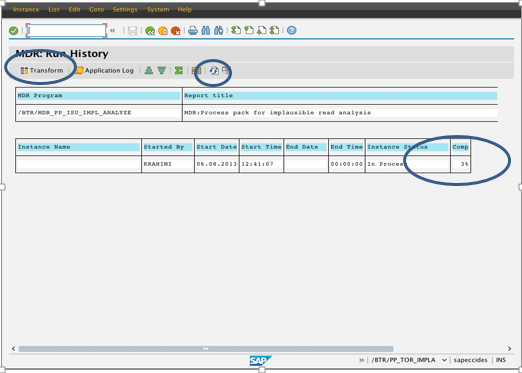
Select the “Refresh” button until the “Instance Status” becomes “Finished”. You can see how far the program has progressed via the “Comp” column which represents the % complete. Important note: You are able to get to the above screen for a previously run version of this program (or a run that you did not start yourself) by navigating to the “Run History” in transaction /BTR/MDR.
Once the program has reached 100% complete and a “Finished” status, you can select the row and press “Transform”. You will then be prompted with a further ability to restrict the output that is displayed.
Output Options
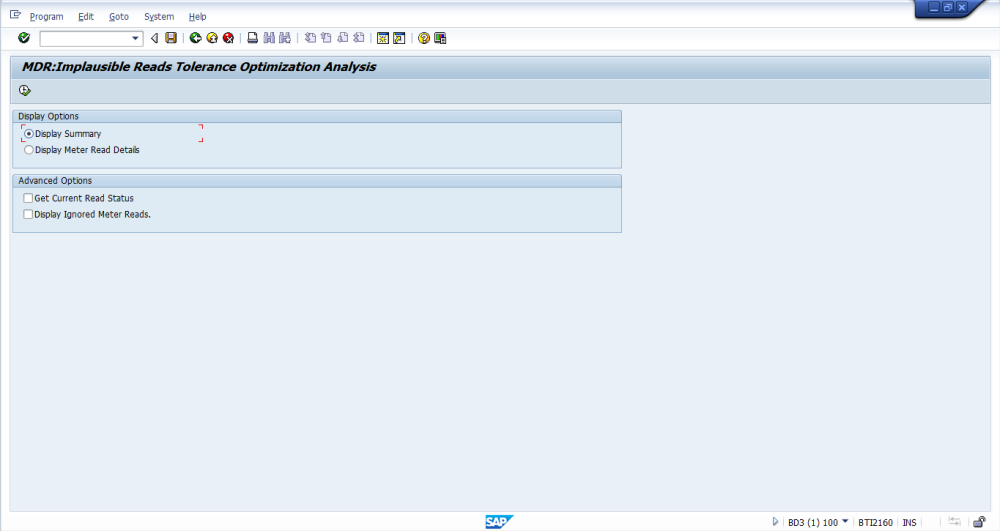
The following options are now available to restrict the data further.
Display Options
• Display Summary – This display provides a summarized view of the tolerance bracket ranges with a graphical display and details options.
• Display Meter Read Details – This enables the results of the implausible meter readings to be displayed in a tabular list view.
Advanced Options
• Get Current Read Status – If you are looking at the results of a past run of the program, then between the time at which the program originally ran and the time that you present the results may mean that the status of a particular implausible read has changed (e.g. to “released” by a user). Select this option if you would like the output to re-calculate the current status of implausible reads, so those that are no longer implausible can be removed. This option generally does not need to be turned on.
• Display Ignored Meter Reads – For each implausible read that is found by the program, a calculation is done to determine the expected consumption / meter reading and the upper / lower tolerance limits. For some implausible reads, these values cannot be determined. A common example of this is when an implausible read has become implausible because the previous meter reading is also implausible. In these cases, the expected and upper / lower tolerance limits cannot be determined and will be “blank”. Therefore, there is no deviation from either a consumption or percentage perspective. If you select this option, those “ignored” implausible reads will be output to the screen.
After you are ready to proceed, select “Execute”. You will then be prompted with the results of the implausible red analysis output:
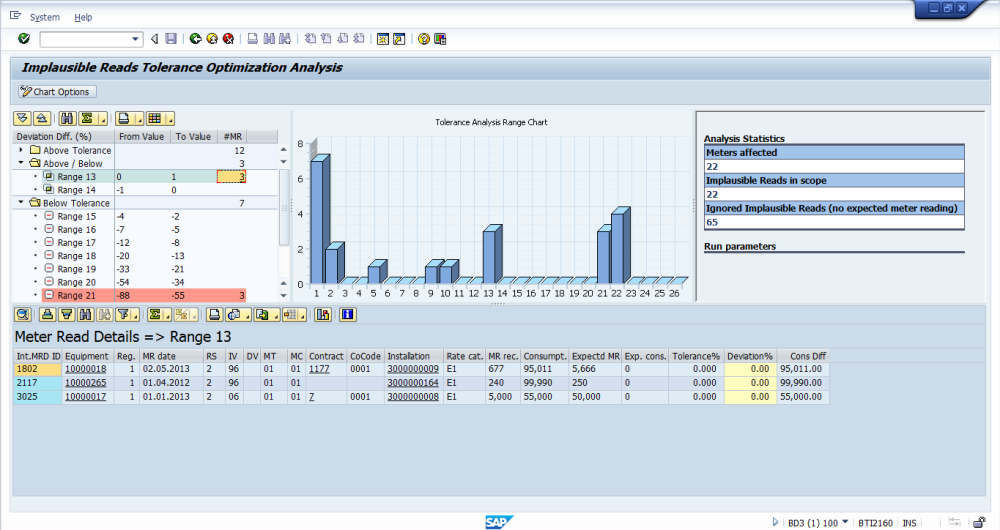
The output of the Implausible Read Tolerance Analysis program is an ALV grid of data that represents the current state of all implausible reads found based upon user selection criteria. On the left of the screen is this list of implausible reads. On the right of the screen are the program execution parameters. By default, the fields displayed in the grid are (from left to right):
• Status
Red light indicates the read is still implausible and a green light indicates the reading has been released since the report was run (this is only displayed if the ‘Get Current Read Status’ checkbox is selected).
• Internal Meter Reading Document Number
Represents the unique meter reading document identifier. You can double click on this field for a particular row in the grid and it will take you to the meter reading itself in the standard IS-U transaction.
• Equipment Number
Represents the equipment number that the implausible read belongs to. You can double click on this field for a particular row in the grid and it will take you to the display of the device / meter within the standard IS-U transaction. From here you could then also display the meter reading history, other device time-slices, the installation etc.
• Register Number
Represents the register number of the meter that the implausible read belongs to.
• Meter Reading Date
Represents the actual meter reading date of the implausible read.
• Meter Reading Status
Represents the meter reading status of the implausible read.
• Independent validation
Represents the independent validation of the implausible read.
• Dependent validation
Represents the dependent validation of the implausible read.
• Meter reading type
Represents the meter reading type of the implausible read.
• Meter reading category
Represents the meter reading category of the implausible read.
• Contract
Represents the contract relating to the implausible read.
• Company code
Represents the company code associated to the contract related to the implausible read.
• Installation
Represents the installation relating to the implausible read.
• Rate Category
Represents the rate category relating to the implausible read.
• Meter Reading Recorded
Represents the meter reading of the implausible read.
• Consumption
Represents the consumption amount (in the units of the measurement device).
• Expected Meter Reading
Represents the meter reading that was expected according to whatever extrapolation has been applied to the meter reading period, whether it be via an extrapolation user-exit or period consumption set at the register installation level.
• Expected Consumption
Represents the consumption that was expected.
• Tolerance (%)
Represents the percentage difference between the expected consumption and the upper (or lower) consumption tolerance limits. This should map directly to the tolerances that have been set within the standard implausibility configuration (with rounding issues for low consumption entries).
• Deviation (%)
Represents the percentage deviation between the actual consumption (above or below) the expected consumption.
• Consumption Difference
Represents the numerical difference between the expected consumption and the actual consumption. It is this value that is used if you have opted to automatically release implausible reads that fall between a certain consumption ranges.
There are five additional fields that can be seen within the grid if you select the “Change Layout” option and add the fields into the display:
• Upper Limit of Meter Reading
Represents the upper limit of the meter reading result based upon validation class tolerances (derived dynamically)
• Lower Limit of Meter Reading
Represents the lower limit of the meter reading result based upon validation class tolerances (derived dynamically).
• Minimum Consumption / Demand
Represents the lower tolerance limit for the consumption based upon validation class tolerances (derived dynamically).
• Maximum Consumption / Demand
Represents the upper tolerance limit for the consumption based upon validation class tolerances (derived dynamically).
• Number
Counter which determines the stats details
You can add into the ALV grid these 5 fields (or remove the others that are available) via the standard ALV grid “Change Layout” option. You can also set a default layout according to your preferences so you do not need to change it each time you display the output of the implausible read tolerance analysis program.
Furthermore, you can select a particular column (e.g. Consumption difference) and sort it from highest to lowest or vice versa. Additionally you can put a filter upon one or more fields in order to restrict what is displayed or search for a particular equipment or meter reading document number with the standard search button in the grid.
Finally, you are able to export to Excel in order to run enhanced manipulation or analysis of the data.
Post your comment on this topic.