
Once you open SAP Lumira, go to File → New Data set
You can select from various Data sources to create a new data set. For DevAnalytics we recommend to use the Microsoft excel data source as that is how you would export your data from the DevAnalytics tool (as per Exporting of DevAnalytics Data).

Excel file to create data set in SAP Lumira steps:
Step 1 − Go to File → New (Create a data set).
Step 2 − Select a Source − Load an Excel worksheet as a dataset and click the Next icon at the bottom.
Step 3 − Browse the path of .xls file. You have an option to choose the first row as column names. You can hide a particular column from .xls by selecting the Select All option.
Step 4 − You can click the Advance option to select a custom range. You can also include hidden rows and columns. Once correct options are selected, click the create button at the bottom.

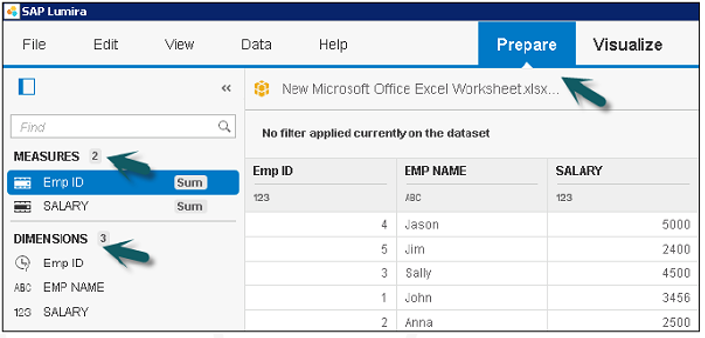
Step 5 − All the data with integer values appear under Measures and all the columns appear under Dimensions. This data will come under the Prepare tab.
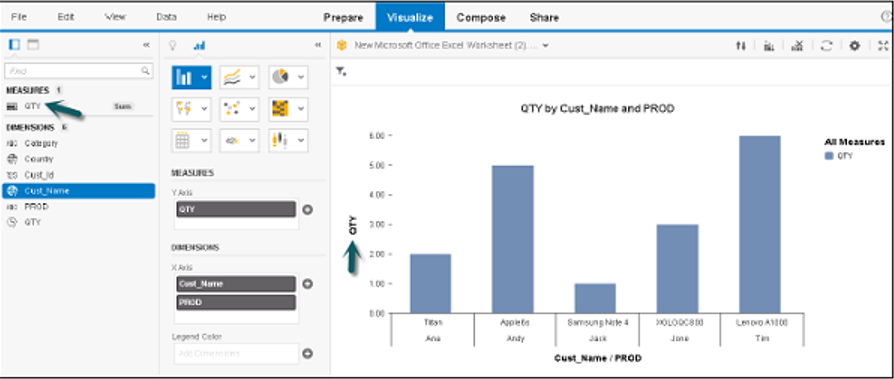
Step 6 − Go to the Visualize tab at the top to create the visualization on top of the data set.
In SAP Lumira, you can quickly create a chart by dragging the objects directly to chart area. To create a chart, the dataset should contain at least one measure value.
When you create a chart in SAP Lumira, it can be used in compose and Share tab for the current session.
Step 1 − If you want to save the chart as document to use it permanently you have to go to File → Save.
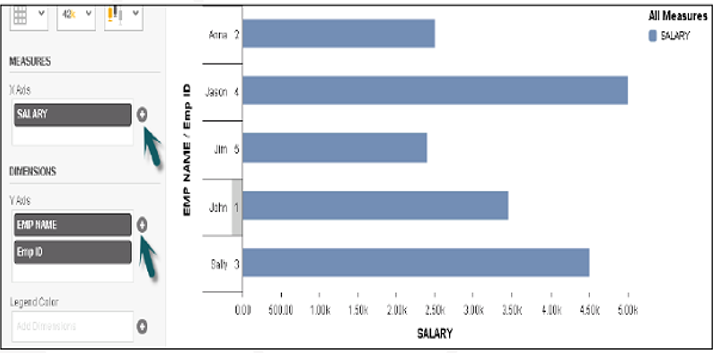
Step 2 − Go to Visualize tab → Select a chart type from the list of available charts and add to chart builder.

Step 3 − Drag the Measures and Dimensions on axis of the chart. The text written in the chart helps you to find out which object is to be dragged to which axis.
You can also add measures as a dimension in SAP Lumira. To do this, add two or more measures as dimensions in the chart. This can be used to check how data is spread over multiple axis in a single chart.
Step 1 − Go to Visualize tab → drag measure to measure panel.
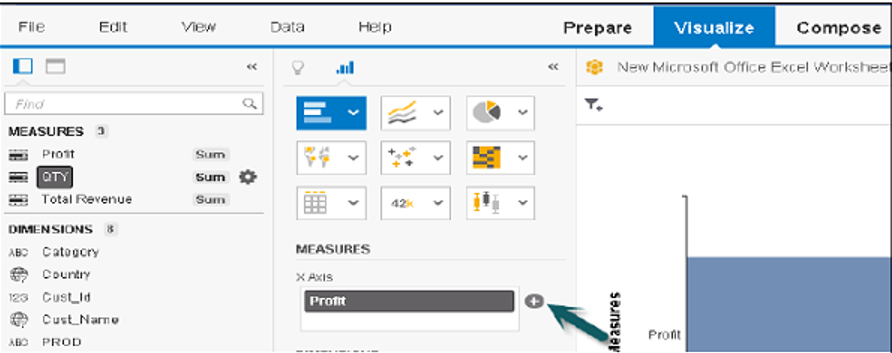
Step 2 − Go to Settings and click use Measures as dimensions option.

Once you select this option, measures are displayed as new measure dimension in Dimension panel.
Step 3 − Now you see the Dimension axis, measures will be added to the dimensions panel.

Step 4 – Add a dimension to this chart and see how it works.

Post your comment on this topic.