
When you login to Power BI Data visualization tool, below user interface is seen. This is known as the Power BI Desktop work area.

Transform and clean data, create a model
In Power BI, you can clean and transform data using the built-in Query Editor. With Query Editor you can make changes to your data, such as changing a data type, removing columns, or combining data from multiple sources. It’s a little bit like sculpting – you can start with a large block of clay (or data), then shave pieces off or add others as needed, until the shape of the data is how you want it.

Each step you take in transforming data (such as rename a table, transform a data type, or delete columns) is recorded by Query Editor, and each time this query connects to the data source those steps are carried out so that the data is always shaped the way you specified.
The following image shows the Query Settings pane for a query that has been shaped, and turned into a model.
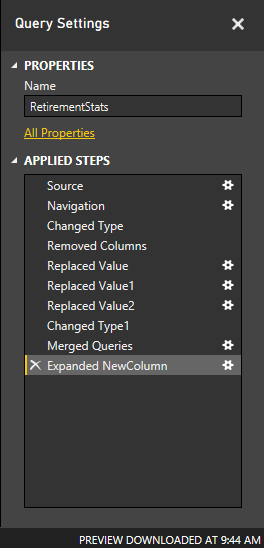
Once your data is how you want it, you can create visuals.
Create visuals
Once you have a data model, you can drag fields onto the report canvas to create visuals. A visual is a graphic representation of the data in your model. The following visual shows a simple column chart.
There are many different types of visuals to choose from in Power BI. To create or change a visual, just select the visual icon from the Visualizations pane. If you have a visual selected on the report canvas, the selected visual changes to the type you selected. If no visual is selected, a new visual is created based on your selection.

Create reports
More often, you’ll want to create a collection of visuals that show various aspects of the data you have used to create your model in Power BI. A collection of visuals, in one Power BI Desktop file, is called a report. A report can have one or more pages, just like an Excel file can have one or more worksheets. In the following image you see the first page of a Power BI Desktop report, named Overview (you can see the tab near the bottom of the image). In this report, there are ten pages.
Share reports
Once a report is ready to share with others, you can Publish the report to the Power BI service, and make it available to anyone in your organization who has a Power BI license. To publish a Power BI Desktop report, you select the Publish button from the Home ribbon in Power BI Desktop.Once you select Publish, Power BI Desktop connects you to the Power BI service using your Power BI account, and then prompts you to select where in the Power BI service you would like to share the report, such as your workspace, a team workspace, or some other location in the Power BI service. You must have a Power BI license to share reports to the Power BI service.
Post your comment on this topic.