
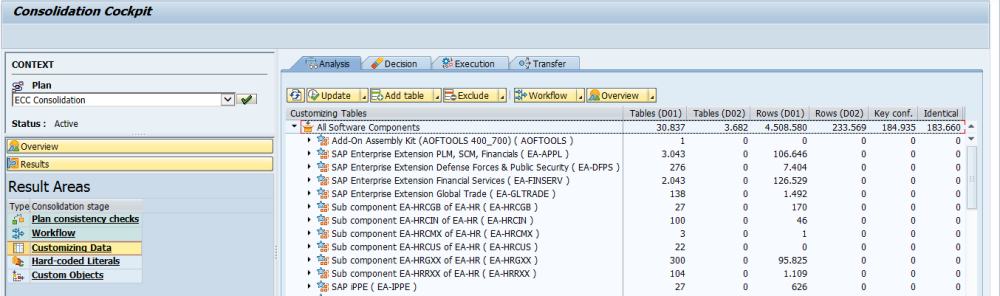
The Analysis phase of the Customizing Data stage will provide the number of configuration tables from each system, the number of rows of data involved and the number of conflicts that have been found.
Once the Analysis programs have run from the Operation section it is time to view the results, go to the ‘Results’ drawer and select the ‘Customizing Data’.
The results are broken down by software component and reveal the number of tables and rows of data in each system as well as identical rows and conflicts.
The buttons on this screen operate by clicking the right hand down arrow ![]() details on what each button does are as below.
details on what each button does are as below.
The ‘Update’ button  allows the user to run the programs for this phase individually, however, it is recommended the user does not use this and completes this through the operation drawer as this adds greater clarity.
The ‘Add Table’ button  allows the user to add tables that are not of a delivery class of customising (C or G) that you want to bring into the Analysis. Tables can be added just to this plan or globally for any future consolidation plans.
The ‘Exclude’ button  allows the user to exclude tables from being considered in the rest of the consolidation process, they can also be added back in this phase if the decision needs to be reversed.
The ‘Workflow’ button  allows the user to open and close this phase.
The ‘Overview’ button  allows the user to view the reports for this phase, see the Reporting section for more details.
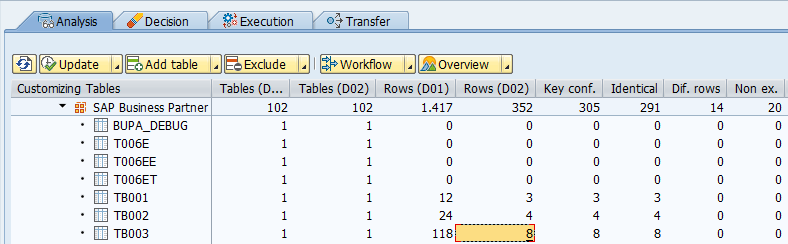
The table holds large amounts of information, broken into nodes at the software component level, the screenshot below shows data accumulated into the nodes. Explanations for what each column represents are provided below the screenshot.
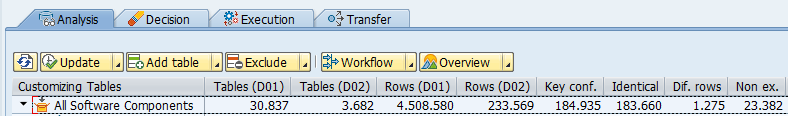
Tables – This contains the number of tables in each system for each node
Rows – This contains the number of tables in each system for each node
Key Conflict – This contains the number of rows with a conflicting key
Identical – This counts the number of identical rows between the two systems
Different Rows – Rows where the key conflicts, but the data is different
Non Ex. – Lines not existing in the target system
The screenshot below shows where the user has navigated to the SAP Business Partner node and opened it to reveal tables, while the columns above are still relevant the other columns may also now be populated. Explanations for what each column represents are provided below the screenshot.
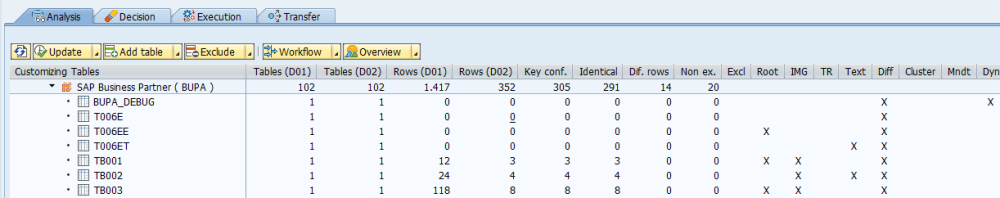
Root – Indicates this table is a root table, this means that the key of this table is a foreign key for a number of other tables and therefore if we need to translate they key of the root table it will impact other tables.
For example if plant 1100 exists in both systems, but represents plant therefore the root table (T001W) is updated with plant 1100 from the source system translated to 9100. However, plant 9100 now has to be updated in the root table and all references in tables that link back to the root table.
Excl – This table has been excluded as per the button ‘Exclude’ button
IMG – Is an IMG node
TR – The table is in a transport
Text – The table is a text table, a table holding different descriptions of a field in different languages and is linked to a table that holds technical setup details
Diff – There are structural differences in this table when the two systems are compared
Cluster – The table is a cluster table
Mndt – Only has client (MANDT) as a key, so only one row of data can be held
Dynamic Calls – This means the table contains, a field relating to a program name, a class name or a function module name. Therefore the references here may lead to dynamic calls to different code and this should be checked.
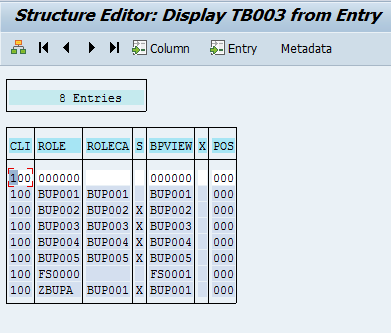
On a table row all of the numbers in the columns ‘Rows’, ‘Key Conflict’, ‘Identical’, ‘Different Rows’, and ‘Non Ex.’ can be clicked and results reviewed.
Example of results retrieved.
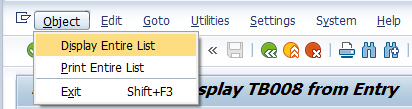
Note that the standard SAP display does not display large numbers of entries, to see all entries, select ‘Object’ then ‘Display Entire List’ as below.
There are also a number of options seen by using a right mouse click on a table.
The ‘Display’ option allows the user to display the table structures in each system or to compare the structures.
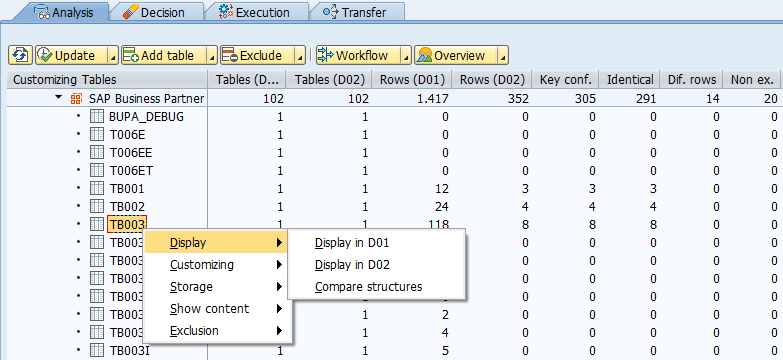
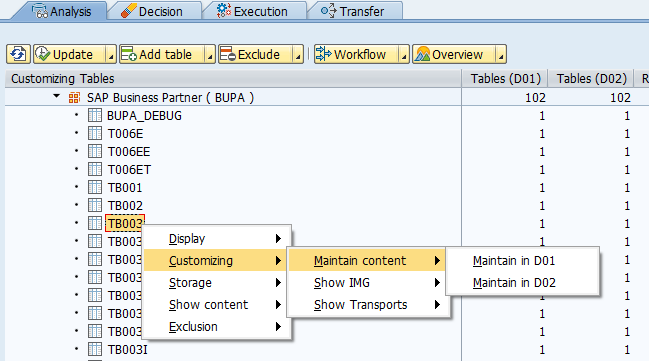
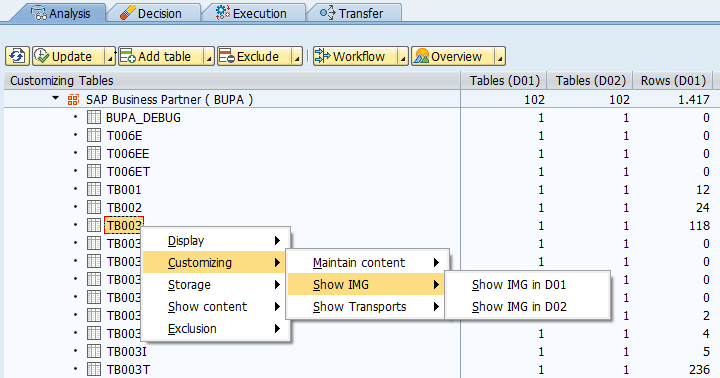
The ‘Customising’ option allows the user to have a number of options.
Including being taken to the maintenance screens if these exist.
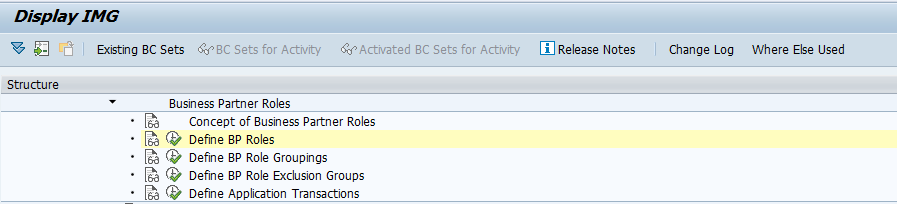
To be able to navigate to the IMG in the chosen system.
Or to be taken to transports that contain this configuration.
![]()
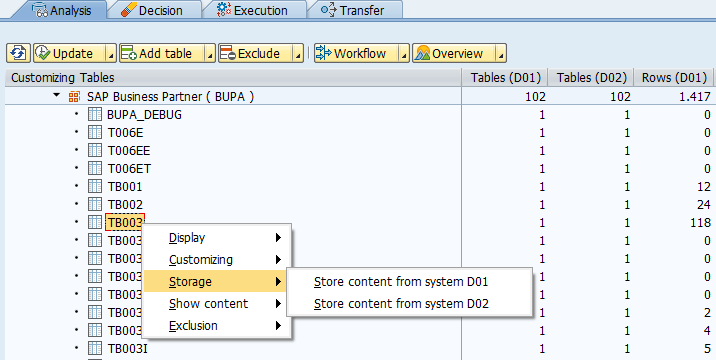
The ‘Storage’ option allows the user to bring the latest data in from the respective systems and store it into the controller system.
The ‘Show Content’ option allows the user to view the entries in each system or compare data.
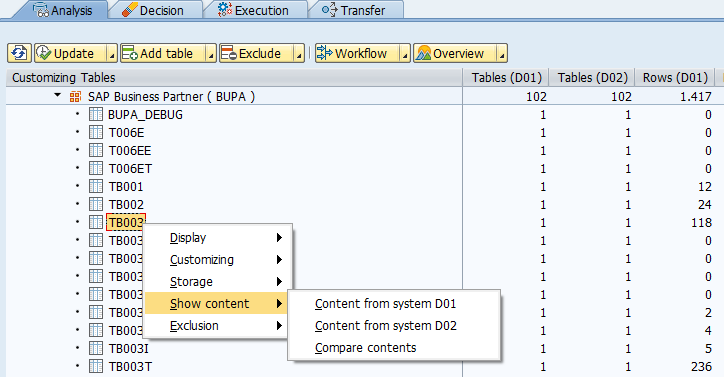
Data comparison option as below:

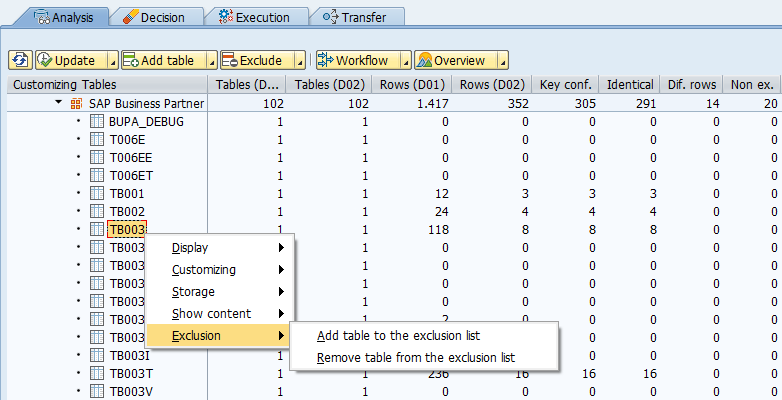
The ‘Exclude’ option allows the user to exclude tables from being considered in the rest of the consolidation process, they can also be added back in this phase if the decision needs to be reversed. This is the same as the ‘Exclude’ button .
When you are certain you are ready to close the phase use the ![]() option on the ‘Workflow’ button and select close phase. Continue to the next phase Decision Phase.
option on the ‘Workflow’ button and select close phase. Continue to the next phase Decision Phase.
Post your comment on this topic.