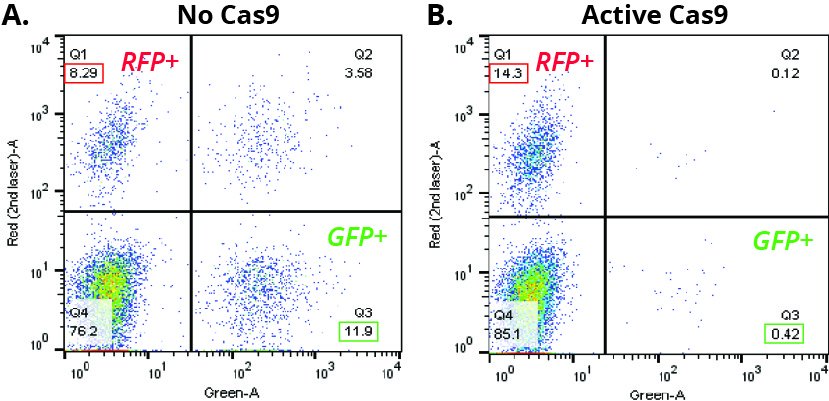
The following is an example of data generated from a CRISPRtest experiment in MDA-MB-231 cells.
Flow Cytometry Scatter
Figure. CRISPRtest experimental data, showing flow cytometry scatter plot analysis of GFP and RFP expressing cells at Day 10 in (A) Parental and (B) Cas9 expressing MDA-MB-231 cells. The percentages of RFP-positive cells calculated in the GFP- RFP+ quadrant Q1 and GFP-positive cells in the GFP+ RFP- quadrant Q3 are used to calculate the percent knockout in the table below.
Calculations
| Calculations | Parental Cells Day 10 | Cas9 Cells Day 10 |
|---|---|---|
| %RFP | 8.29% | 14.3% |
| %GFP | 11.9% | 0.42% |
| GFP:RFP | = 11.9 / 8.29 = 1.44 | = 0.42 / 14.3 = 0.03 |
Calculate %KO using [(GFP:RFP)Cas9 / (GFP:RFP)Parental] as follows:
1 – (0.03 / 1.44) = 98%
Last modified:
15 March 2024
Need more help with this?
Contact Us


