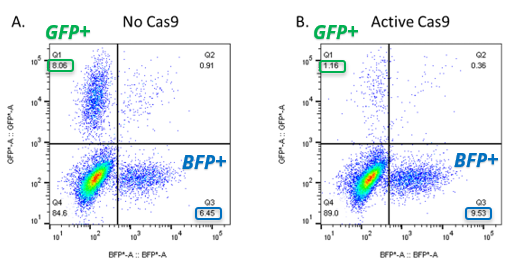
The following is an example of data generated from a CRISPRtest_GB experiment in Neuroblastoma Cas9 cells.
Flow Cytometry Scatter

Calculations
| Calculations | Parental Cells Day 10 | Cas9 Cells Day 10 |
|---|---|---|
| %BFP | 6.45 % | 9.53% |
| %GFP | 8.06% | 1.16% |
| GFP:BFP | = 8.06 / 6.45 = 1.25 | = 1.16 / 9.53 = 0.12 |
Calculate %KO using [(GFP:BFP)Cas9 / (GFP:BFP)Parental] as follows:
1 – (0.12 / 1.25) = 90%
Last modified:
25 March 2024
Need more help with this?
Contact Us

