
Introduction
Now that the usage information has been retrieved from the source system and the prioritisation run as completed, you can run the coverage analysis proper.
The coverage analysis run will compare the transaction volumes captured in your recording (by reading the execution queue) with the data from the usage retrieval, determining whether or not a particular transaction (or batch job, RFC, etc.) has been adequately covered in the recording.
Executing the Coverage Analysis
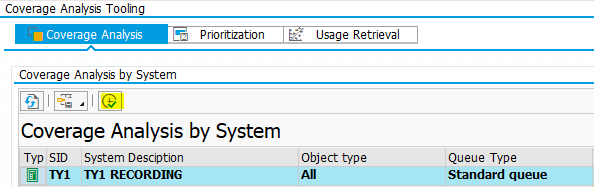
From the Coverage Analysis tab, select your source system and click on the Execute button.
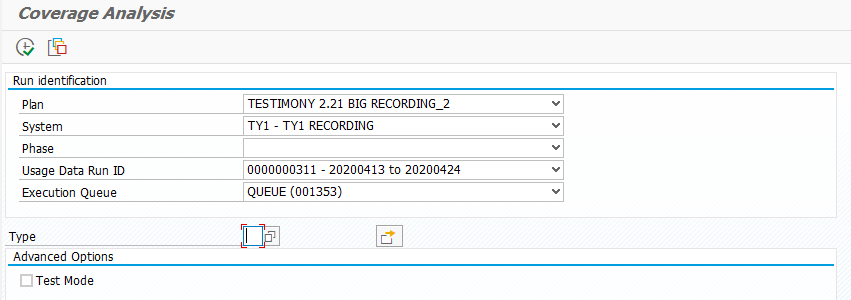
On the selection screen, enter the usage retrieval run and the execution queue you want to compare against. Optionally, you can also restrict the coverage analysis to certain types of workload (e.g., dialog transactions only).
NB, you may need to press Enter to refresh the screen’s fields, and see the correct list of Run IDs
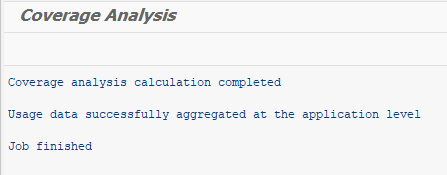
Click on Execute and the coverage analysis will run, displaying this output at the end.
Analysing Coverage Analysis Results
Once the coverage analysis has run, you will see a summary of the results in the Coverage Analysis screen. The summary shows the analysis for the entire execution queue, as well as broken down by different transaction types.
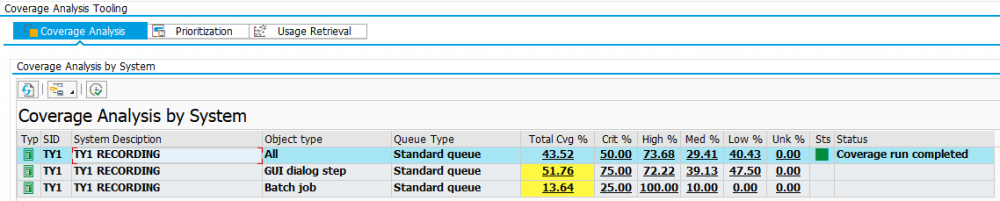
In the image above, we can see that the overall coverage for all transaction types was 43.52%, with the coverage also broken down by priority and by transaction type.
For a transaction to be covered in the execution queue and count towards the coverage percentage, it must exist at least once in the execution queue.
As well as the results summary, you can double-click on a row in the summary to get details of the coverage broken down by application component as well as at the object level

As you can see from the object view, for each object you are told whether or not it is covered (i.e., whether or not it exists in the execution queue), the priority according to the prioritisation, and the “Depth”.
The Depth of an object’s coverage is a comparison of the number of times it will be executed in the playback (normalised to a 24-hour period) with the average number of executions per day from the usage retrieval.
For example, in the object view in the image above, we can see that transaction MD04 was executed on average 4.1 times per day in the source system. In the execution queue, this transaction has a normalised daily execution rate of 47.03 executions per day. This transaction is therefore covered (it exists in the execution queue) and it has a depth of 100% (its number of executions in the execution queue is greater than or equal to the daily rate in the source system).
On the other hand, transaction SM30 has a source system daily execution rate of 47.5, but an execution queue rate of 10.85. Since the execution queue rate is lower than the source system rate, although it is covered it has a depth of only 22.85%.
Post your comment on this topic.