
Overview
During the recording phase, which may last for any length of time, it is important whilst you become accustomed to Testimony that you monitor the production systems that are being recorded.
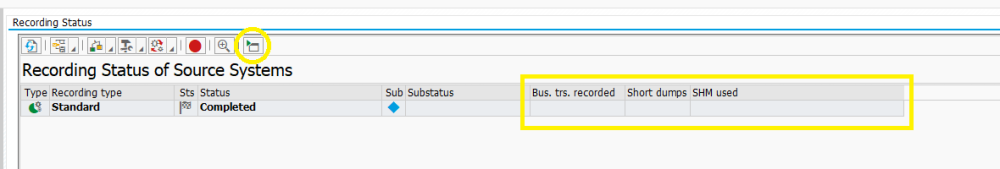
Testimony provides some basic extra information during hte recording, which you can see if you click the Extended View button from the Recording Status screen, to give a count of business transactions recorded, the number of shortdumps seen since recording started, and the current Shared Memory Usage:
There are various standard SAP tools that can be used to monitor the SAP system for anomalies. Most of these transactions would be run directly in the system to be monitored. These include:
(1) Monitor Short-dumps (ST22) – Testimony has been designed to ensure that it has no impact on production. However, in the early days of use of Testimony, you might like to ensure that users and batch jobs are not being impacted by monitoring for any short-dumps. Run transaction ST22 in the systems being recorded and look for any short-dumps directly specifying that Testimony related objects are involved (i.e. /BTI/AUT* related objects). You might like to check this more regularly after recording is turned on (e.g. every 5 minutes), then reduce the frequency as the recording progresses (e.g. every 1 hour after the first hour of recording is complete).
(2) Monitor Long Running Processes (SM66) – We recommend the use of SM66 (rather than SM50) since it is across all application servers of the system you are monitoring. In this transaction, you are looking for long running background processes that would usually be fast, this is to check for a batch job that has become long running.
(3) Monitoring Testimony jobs (/BTI/AUT) – The main job that runs on the source system is /BTI/AUT_SAVE_BTRAN_PERIODIC. Every minute, it saves data out of the shared memory and into the database and will run for the full length of the recording. The central system also checks this job is running to update the central system and ensure that the RFC connection to the source system is still operating.
(4) Monitor Shared Memory – Testimony achieves what it does with near zero impact on production by using shared memory to save the recording before the job above runs to move this to the database. Shared memory is allocated per application server on the system being recorded and is set via the profile parameter rsdb/esm/buffersize_kb. As a part of the installation there will be recommendations on the amount of shared memory that will be required.
To monitor shared memory in the Central System the Shared Memory Explorer (more details in the link) should be used. It enables a view of all the app servers on one system as well as the objects contained in each app server’s shared memory, it details the memory availability and usage as well as the maximum objects available and their usage.
If the RFC user to the source system does not have the correct authorisations the Shared Memory Explorer view can be restricted. In this case you can use the SAP standard transaction ST02 on the source system to monitor each application server. This transaction only shows you the shared memory of the application server you are currently logged onto. In order to check other application servers, you should use transaction SM51 in order to jump between the application servers and then once switched, run transaction ST02.
You should be checking the row that says “Exp./ Imp. SHM”. The column “Alloc. KB” shows how much has been allocated for that particular application server. This should be reflected in the profile parameter setting in transaction RZ11. The current level of shared memory (the amount of free space) is then seen in the following column “Freesp. KB”. Other processes in SAP can use up the shared memory (not just Testimony), so this means you’ll see this value typically lower than what was allocated in the profile parameter.
The key task is to ensure that this value does not get close to zero (0KB) if the shared memory limit is reached or no shared memory is left then Testimony will abort the recording.
(5) System Messages (SM21) – You can check various system messages via transactions in SM21 whilst the recording is running. Short-dumps would be reflected in here. If there looks to be any anomalies that you do not expect, then investigate appropriately and if required, deactivate the recording.
If any significant impacts are detected (e.g. from a performance or impact perspective), you can deactivate the recording immediately.
(6) Recording Table Entries – In the system being recorded (Source), new entries for captured steps will be written into table /BTI/AUT_BUTR at least every 60 seconds as they are flushed from the shared memory. Depending on activity, this may be more frequent. To check that entries are still being written, go into transaction SE16 on the Source system and click ENTER. In the screen that follows, click on the “Nimber of Entries” button and verify that the row count is increasing.
Post your comment on this topic.