
During test execution, CT 2025.06 provides the [Debug in VS Code] feature to analyze the cause of any unexpected results. This feature supports debugging in [VS Code] by reflecting the input values, stubs, and class factories applied to the test cases as they are.
Conditions for Using [Debug in VS Code]
To use [Debug in VS Code], the toolchain set for the project must meet one of the following conditions:
- A GCC, Visual Studio, or Clang toolchain extracted using [Extract Toolchain info]
- A toolchain with a conversion toolchain that meets the above condition
To use [Debug in VS Code] in a Docker project on Windows, the version of the toolchain set in the project must match the version of the toolchain configured in the Docker image. When using the Clang toolchain, the CodeLLDB extension must be installed in VS Code.
Install VS Code
- To use the [Debug in VS Code] feature, VS Code must be installed.The installation can be performed through the official VS Code website. Upon completing the installation, the [Debug in VS Code] feature becomes available in CT 2025.06.
VS Code Settings
- CT 2025.06 uses the VS Code path configured in the system environment variables during the VS Code installation.
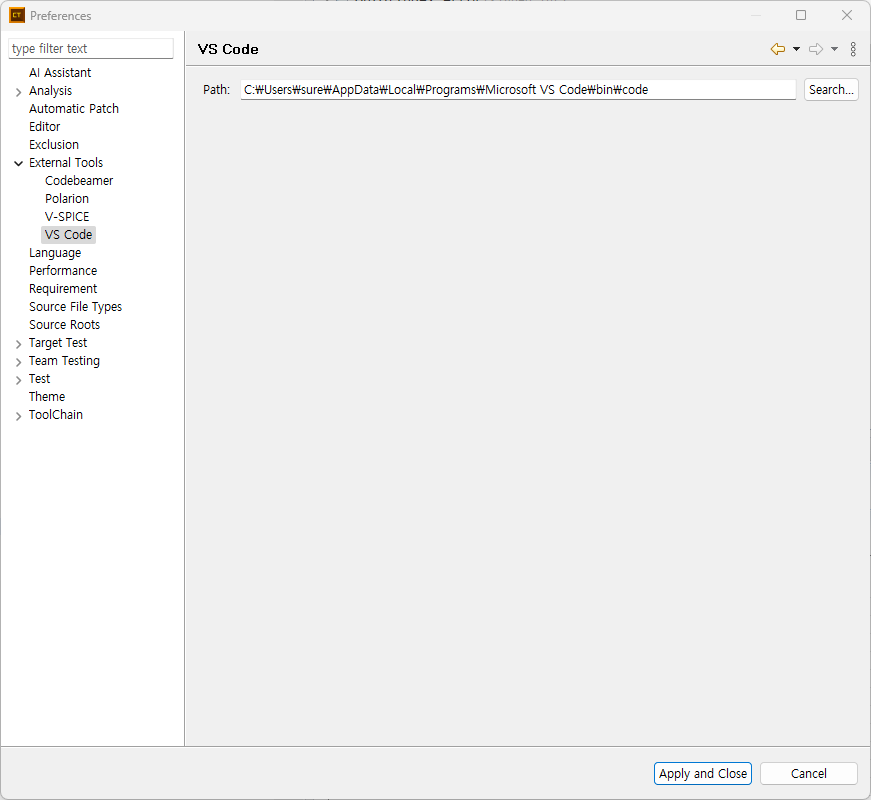
- Enter the VS Code path in [Preferences] > [External Tools] > [VS Code], and then click [Apply and Close].
![]()
- Enter the VS Code path in [Preferences] > [External Tools] > [VS Code], and then click [Apply and Close].
Debug Usage Guide in VS Code
The following example demonstrates how to analyze test case results using the [Debug in VS Code] feature.
Need more help with this?
Don’t hesitate to contact us here.