Each prepackaged lentivector in the PromoterTest Assay has a different promoter driving expression of the same GFP reporter gene. To test the activity of each promoter in your cell line, transduce cells with each lentivector, then compare the GFP fluorescent intensity from each lentivector/promoter.
- Before starting the procedure below, plate and expand your target cells to an appropriate density to ensure they are viable and actively growing.
- The procedure below describes the overall approach to assay the promoter constructs in this Kit. For detailed guidance on the transduction procedure, refer to the General Lentiviral Transduction Protocol in Section 4.
Day 0: Plate and Transduce MOI Dilution Series
- Quickly thaw the lentiviral particles for the promoter constructs in a water bath at 37°C. Transfer the thawed particles to a laminar flow hood, gently mix by rotation, inversion, or gentle vortexing, and keep on ice.
- Suspend cells at a density of ca. 100,000 cells/ml and aliquot 1 ml of suspension into each wells of a 12-well plate. To assay all 10 constructs, aliquot 3 wells of cells for each construct, plus an additional no-virus control (25 wells total) for each replicate.
- Transduce aliquots of 100,000 cells with 3 μl, 10 μl, 30 μl of each packaged viral construct. Do not add virus to control cells.
Note: Unused reagent can be aliquoted, refrozen at -80°C, then used again for subsequent experiments. Repeated freeze/thaw will deplete viral concentrations.
Day 1: Change Medium
- Change culture medium ~24h after transduction.
Day 3: Harvest and Analyze
- At 48 or 72 hours after transduction, harvest the cells and check GFP fluorescent intensity by flow cytometry (488 nM excitation, 530/20 nM emission).
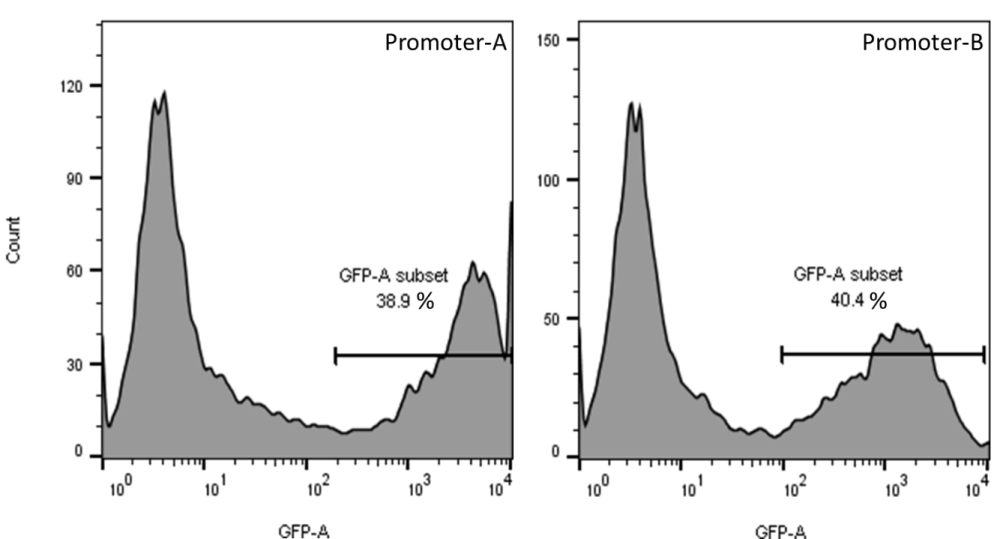
- For each lentivector, select the viral transduction sample (3ul, 10ul or 30ul) which shows between 10%-40% GFP+ cells
Note: If none of the cultures show between 10%-40% GFP+ cells, adjust the amount of virus as needed and redo the transductions.
- Compare the GFP peak intensity generated by cells with each different promoter construct. The one with the highest peak intensity corresponds to the strongest GFP and, therefore, the highest promoter strength. Please see the example data below from cell populations transduced with two different promoters constructs:

Cells transduced with the Promoter-B construct peak at an intensity of ~1.5×10³.
Based on the ratio (4×10³/1.5×103), Promoter A is ~2.5 times stronger than Promoter B in these cells.
Last modified:
17 May 2024
Need more help with this?
Contact Us

