
ActiveControl integration
ActiveDiscover 1.20 enables ActiveControl 9.20 to display impact score information for projects, business tasks and transports.
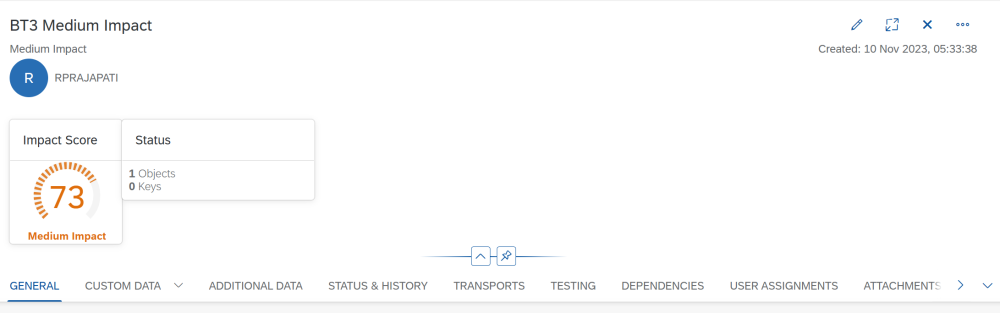
Figure AD-01a: ActiveDiscover impact assessment score in ActiveControl Business Task as a Gauge chart

Figure AD-01b: ActiveDiscover impact assessment score in ActiveControl Global View as a RAG status
Application area impact details
The dashboard card for impact on application areas now includes a “View Details” button which takes the user to a dedicated page that displays all impacted application areas along with a Sankey diagram that shows the hierarchy of impacted areas, weighted either by number of objects, or by impact score.

Figure AD-02: Application area impact details
Interface diagram for external systems
The detail page for impact on external systems now features an interface diagram that visualizes the connections between the impacted remote function modules and the external systems calling them.

Figure AD-03: Interface diagram for external systems
Parallel processing
Both the object relationship analysis and the object comparison now leverage parallel processing, resulting in significant performance improvements.
Additionally, parameters related to parallel processing (number of background processes to be used, size of interval used to divide the work into units) are now exposed in the Settings / Advanced Settings section.
The number of background jobs can also be modified while the analysis is running by clicking on the cog icon next to the analysis progress bar in the “Active Analysis Runs” section.


Figure AD-04: Parallel processing
Configurable criticality levels for critical objects
In the landscape configuration, when adding critical objects, the criticality can now be fine-tuned via setting it to “Low”, “Medium”, or “High”, which assign different minimum impact scores for the object.

Figure AD-05: Configurable criticality levels for critical objects
Display source objects for impacted top level objects
On the detailed page for impacted top level objects, next to the object relationship icon, there is now a new option that can be used to display all source objects for an impacted object as a simple list.

Figure AD-06: Display source objects for impacted top level objects
Default value for analysis name when re-running an analysis
When re-running (copying) a completed analysis, the name of the copied analysis now defaults to a sensible value based on the original name, instead of an empty name.
System comparison dashboard
The results of a system comparison run are now displayed as a dashboard which summarizes the key information about the objects that have been analysed, and the differences that have been found.

Figure AD-07: System comparison dashboard
Display all analysis settings (for audit purposes)
Now it is possible to review all settings that were used to run a particular analysis, including which analysis components were turned on, the list of critical objects and top-level object types, custom weights, and the Failure Prediction customization.
This can be opened from the analysis dashboard by clicking on More / View Analysis Settings. (The option is not available for pre-1.2 analysis runs.)
Improvements for UI5 application analysis
Impacted UI5 applications have now been incorporated into the metric Impact on Active Users and are featured on the analysis dashboard summary.
Post your comment on this topic.