
The Google Analytics Widget can display various dashboards with different metrics. Users can select charts that display:
- Visits in the last week
- Visits in the last month
- Page views in the last week
- Page views in the last month
- Sessions per country in the last week
- Sessions per country in the last month
Information is updated in real time; to see changes in the metrics, refresh the page.
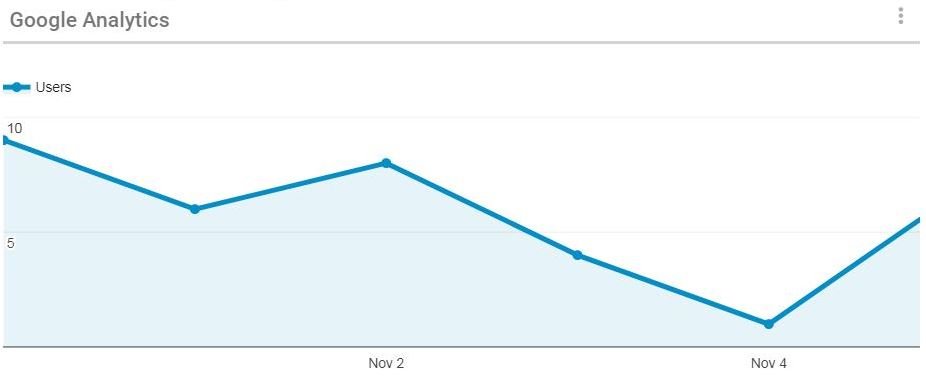
The image below shows a chart for # of user visits in the last week.
The image below shows a chart of the # of page views in the last week.

The image below shows a map of the location of sessions in the last week

To customize the Google Analytics Widget, click here.
Haben Sie noch weitere Fragen?
Visit the Support Portal