
Two populations of dCas9-TA cells are transduced with the CaT-A and CaT-B viral mix reagents, respectively. After 4 days, each population is analyzed by flow cytometry. The mean GFP and RFP fluorescent values of the transduced cells are then used to calculate dCas9-TA activity in the dCas9-TA cells.
The assay was optimized using MDA-MB-231 cells. These dCas9-TA MDA-MB-231 cells are available from Cellecta to use in the assay as a positive control (see Additional Required Materials). Some protocol optimizations may be needed based on the growth characteristics of your cells.
Day 0
- Quickly thaw the CaT-A and CaT-B lentiviral particles in a water bath at 37°C. Transfer the thawed particles to a laminar flow hood, gently mix by rotation, inversion, or gentle vortexing, and keep on ice. Unused reagent can be aliquoted, refrozen at -80°C, and used again for subsequent experiments.
- Suspend dCas9-TA cells in growth medium supplemented with 1X Transduction Reagent, at a density of ca. 100,000 cells/ml.
Note: This cell density was calculated for MDA-MB-231 cells. Depending on cell size and growth, you may need to use a different concentration and correspondingly-sized plate. As a rule of thumb, cells should be transduced at a density such that they would not become confluent before ~48 hours.
- Aliquot 1 ml of cell suspension (100,000 cells) into each of 2 wells of a 12-well plate.
- Add 20 µl of CaT-A virus into one well and 20 µl of CaT-B virus into the other well, mix and return cells to incubator.
Note: For most cell lines, 20 µl of CaT viral reagents will suffice to obtain between 20%-50% RFP+ cells (the recommended % of transduced cells for optimal assay accuracy). For hard to transduce cell lines, more virus might be needed. In doubt, it is recommended to use increasing amounts of CaT-a and Cat-B viruses in separate transductions. For the final calculations, use the samples showing between 20%-50% RFP+ cells on day 4.
Day 1
Exchange medium with fresh growth medium, grow cells under standard conditions for additional 3 days (passage cells as needed, cells should not become confluent).
Day 4
- Analyze cells by flow cytometry, using settings below:
Channel 1: excitation 488nM, emission 530/20nm (GFP)
Channel 2: excitation 561nM, emission 590/20nm (RFP)
- For both CaT-B and CaT-A samples, gate in RFP+ cells as shown below:
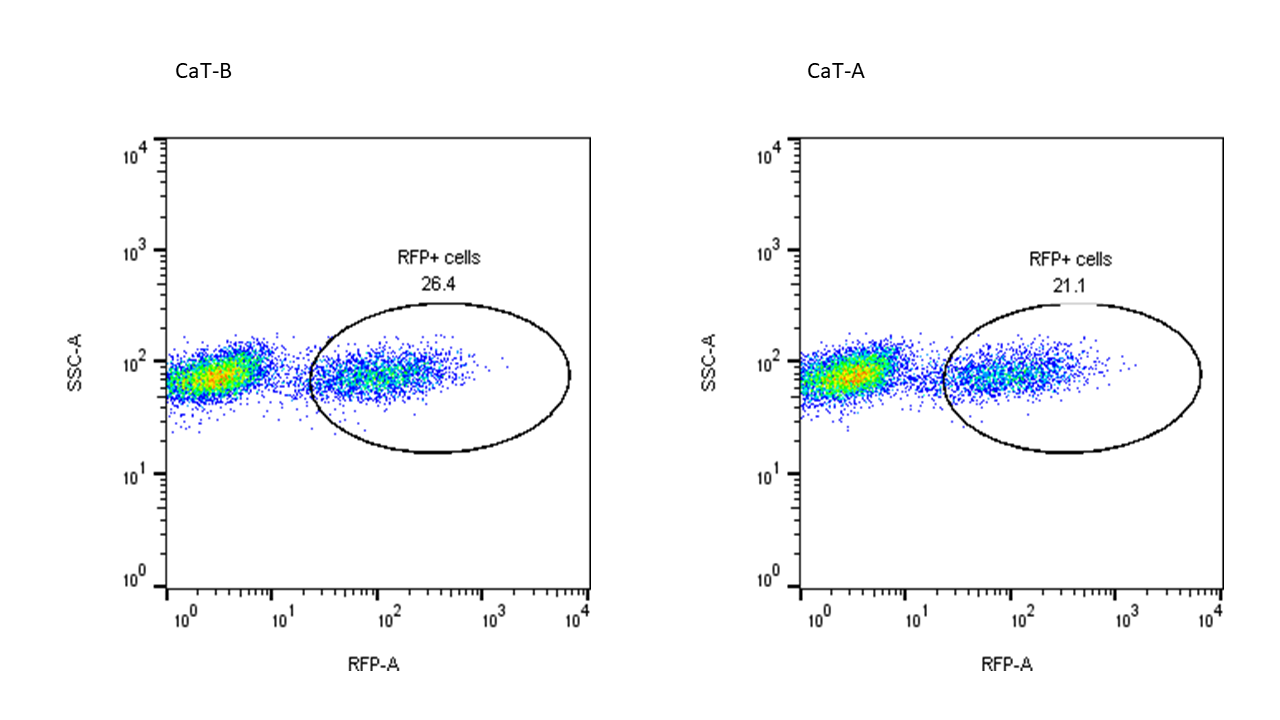
- Calculate the mean GFP and mean RFP intensity for CaT-B (RFP+ cells) and CaT-A (RFP+ subset), then calculate the relative GFP/RFP intensity for CaT-B (RFP+ cells) and CaT-A (RFP+ cells)
Need more help with this?
Contact Us