
Introduction
The Playback Overview, accessed from within the Results tray, shows the results of the playback in various different ways, as explained below.
Failures / Open Defects
In this tab you can see the failures from the playback grouped according to their SAP application component and priorities from the Coverage Analysis. Expanding each.application component tree, you can see the types and numbers of errors (e.g., Unexpected next screen or Unexpected next message).
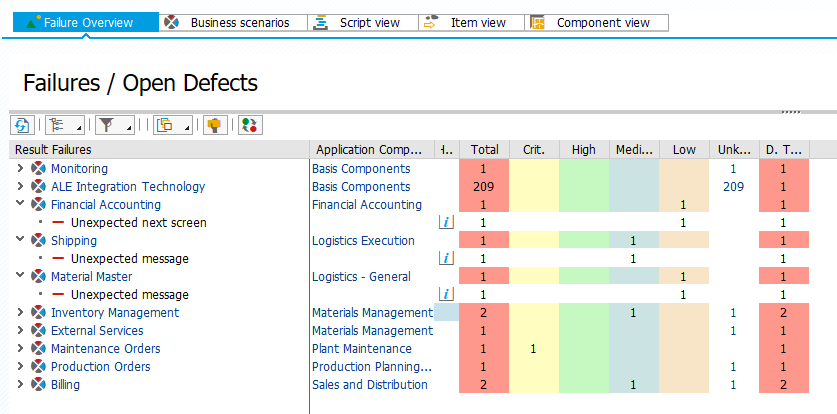
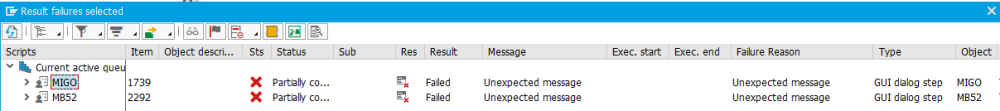
By clicking on the number hot-links in the display, you will show the individual errors for that area. For example, clicking on the number 2 in the Total column for Inventory Management will show you the two individual errors received, in this case that we received unexpected error failures in transactions MIGO and MB52.
From here you can investigate the errors using the Investigate Screen functionality.
This is also the screen from which you generate defects to be investigated as part of the regression test process. By clicking on the “Propose Defects” button, Testimony will analyse all of the reported failures and group them into defects. More information on defects can be found in the Testers’ Guide here.
Post your comment on this topic.