On our web portal my.nofence.no you can view the movement patterns for each of your collars, ever since you first started using them. This portal is a helpful tool to analyse the grazing, and makes it easier to optimize your pasture design. To login, please use the same login details as in the app.
As mentioned, this portal gives you access to see where your collars have been located. However, please note that you can only watch the positions for one collar at a time. In the map you can view time an place for each registered position, as well as sound warnings, electric pulses and escapes.
Please note that it is not possible to create or edit new pastures in the web portal.
Select the time frame you want to view positions from in the upper left corner.
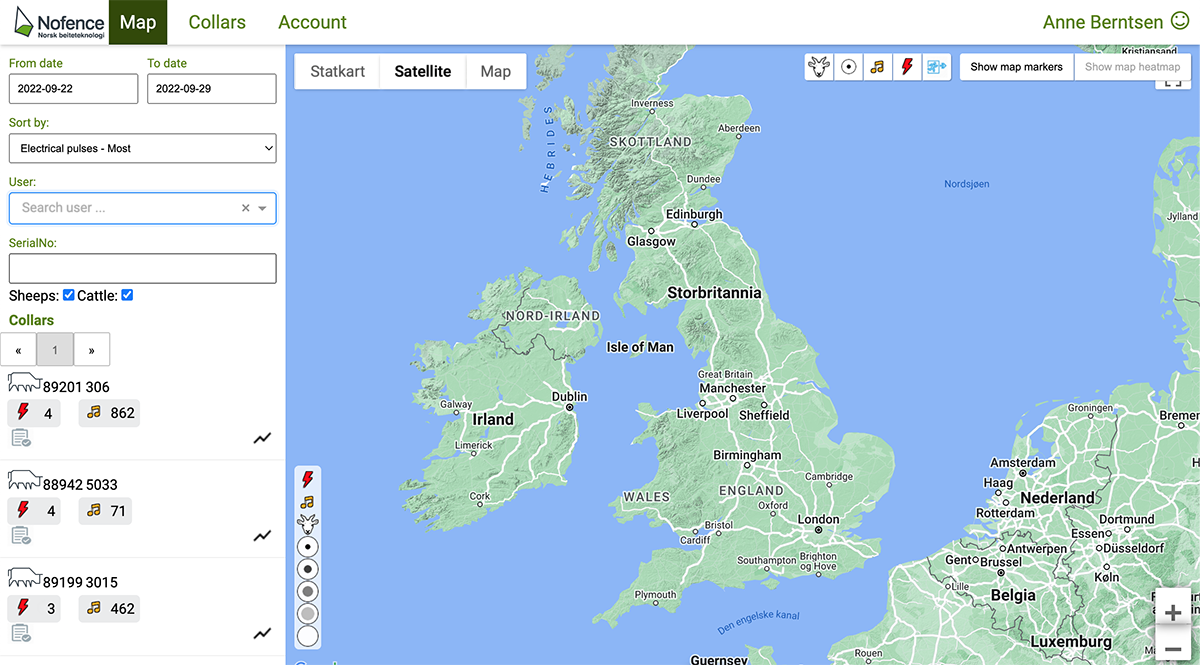
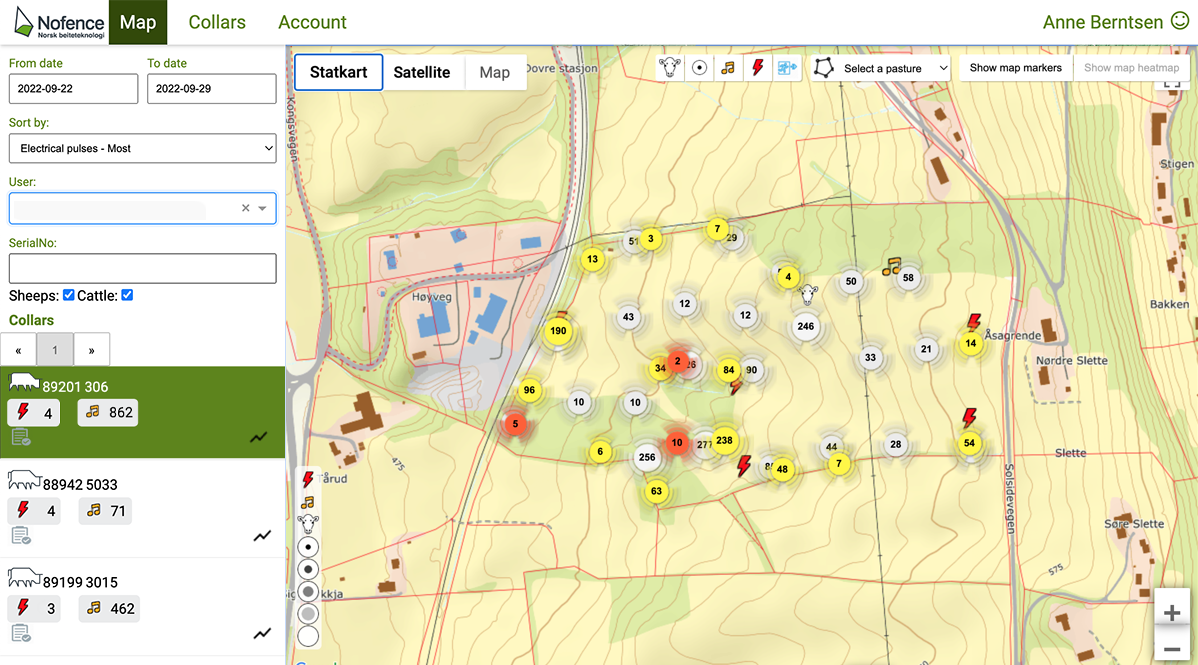
Click on the collar you want to view positions from in the column to the left. You can only select one collar at a time.
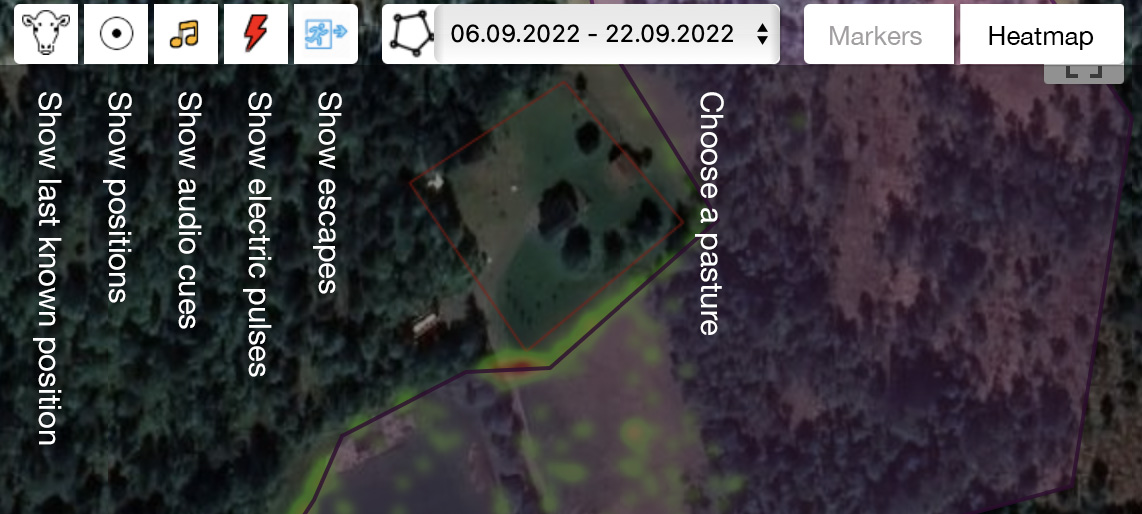
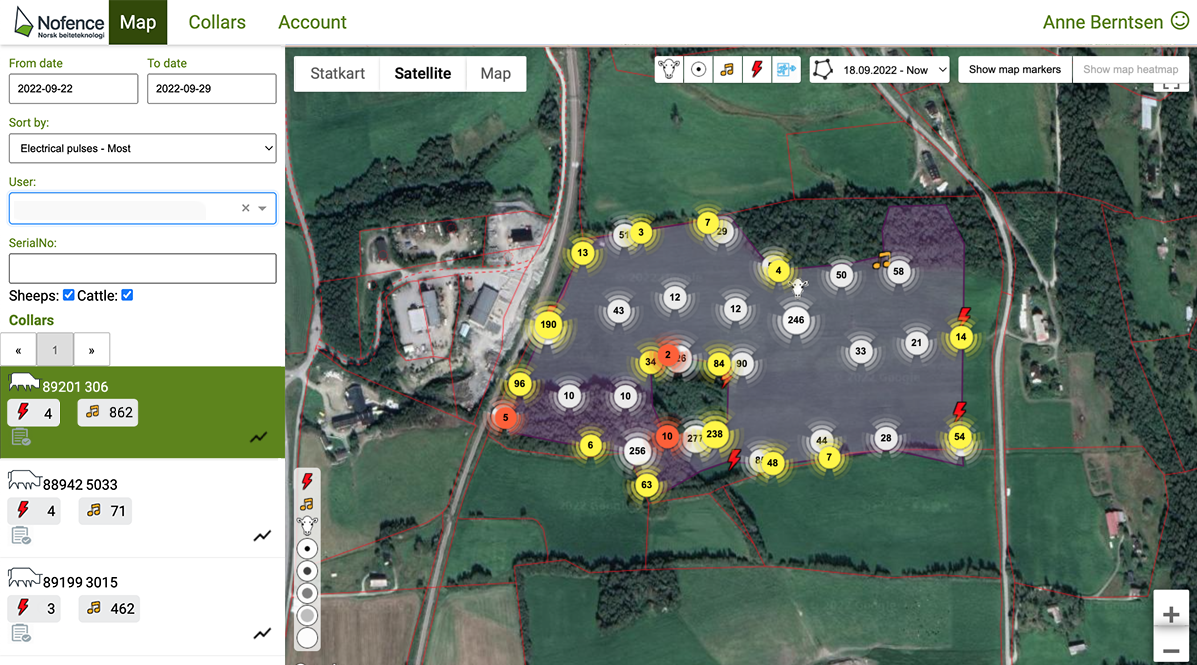
In the upper right corner you can select which pasture you want to view. All pastures from within the selected time period will appear in the drill-down menu. The pasture you select will be marked in purple in the map.
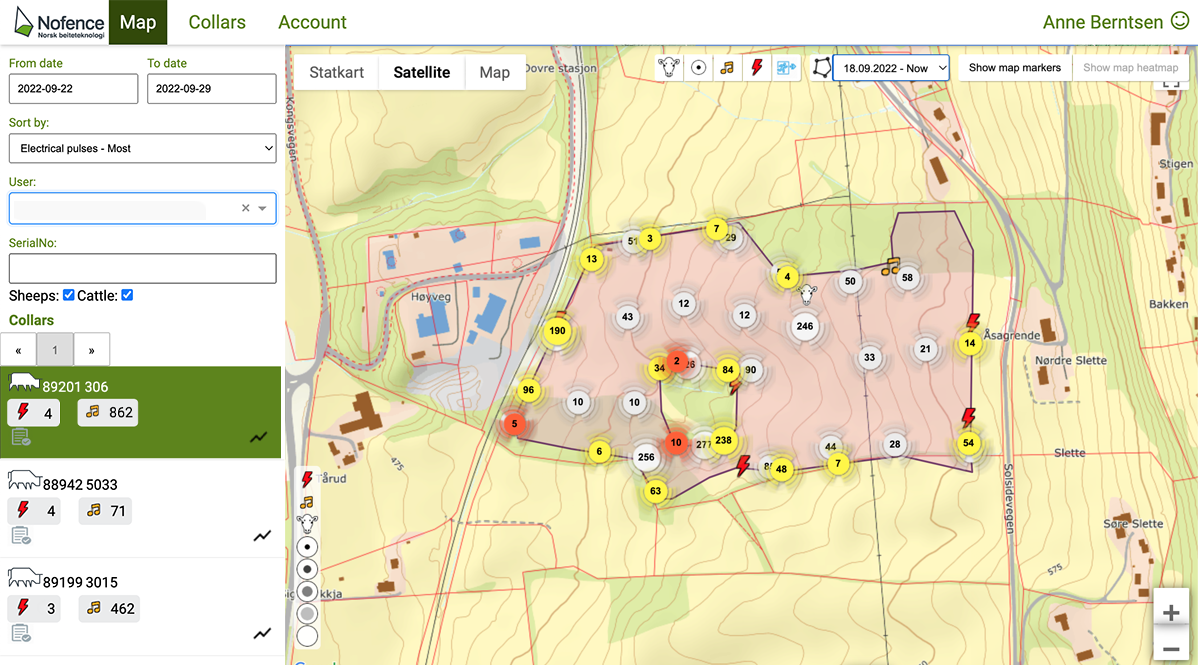
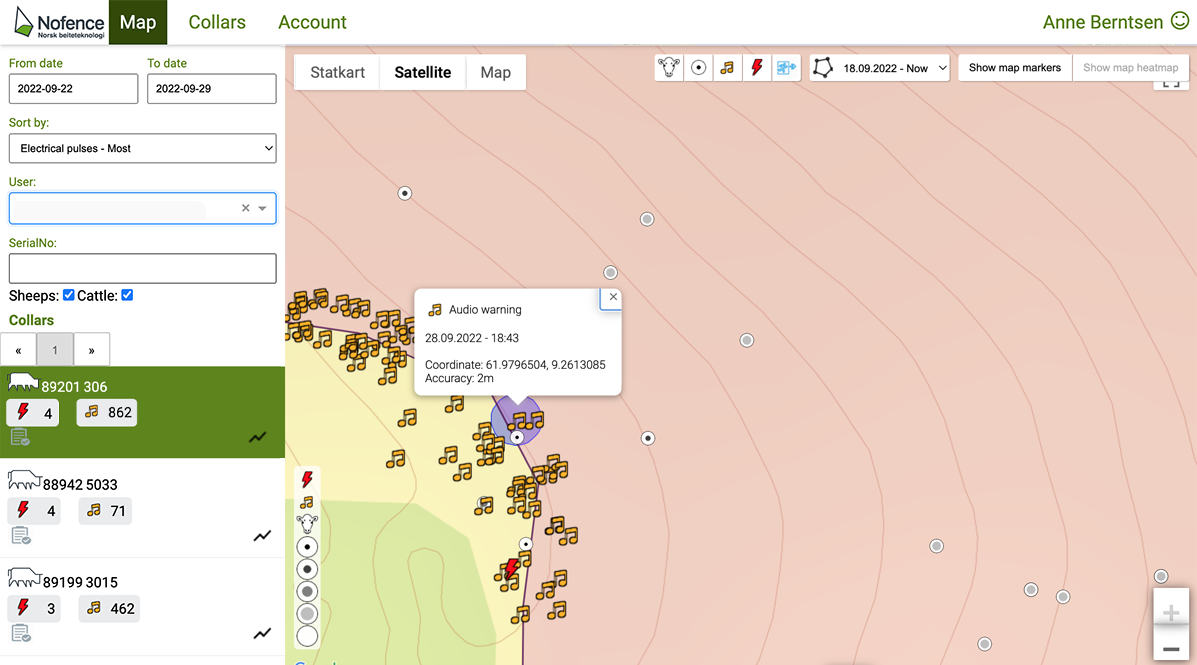
Zoom in to take a closer look at positions and incidents. Click on the position or incident to get more information about each one.
You can choose between satellite map and fly photo. In Norway you can also choose “Statkart”. The pictures are from the satellite map.
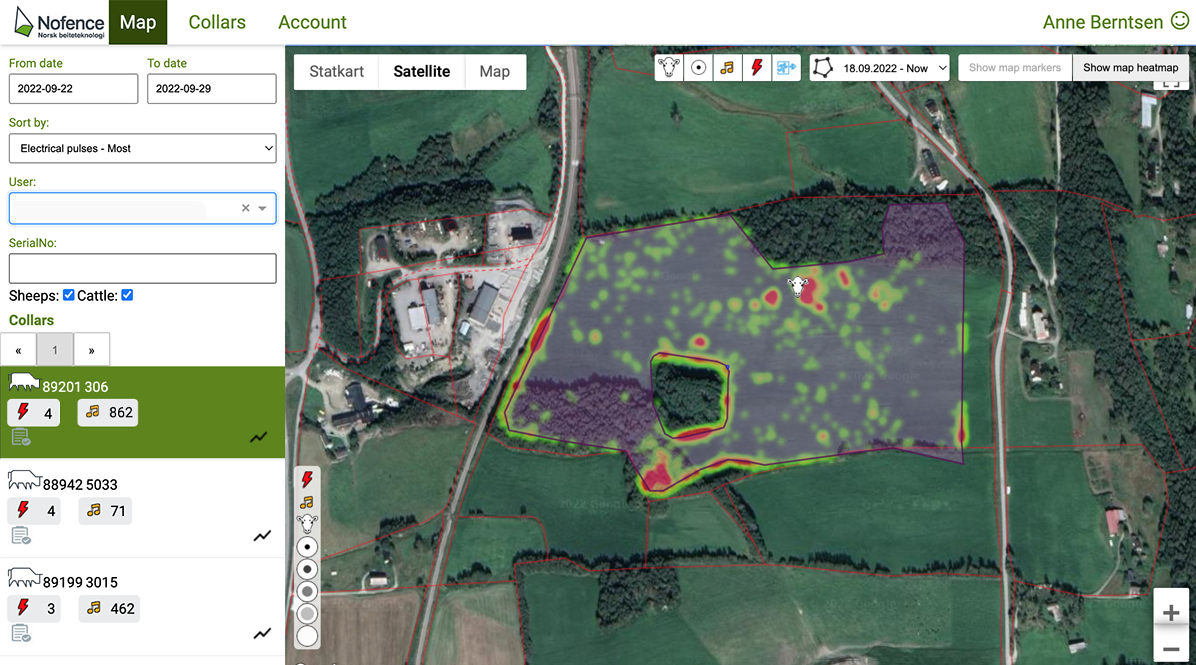
Choose heat map in the top right corner to see what part of the pasture the animals are using the most.
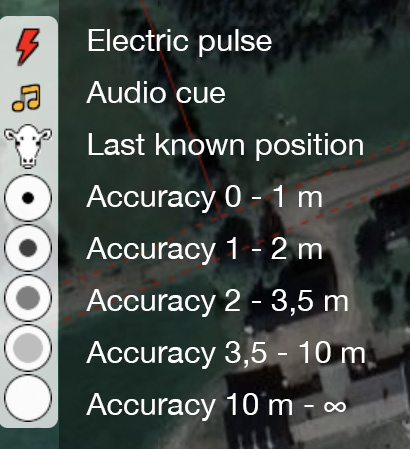
Symbols in the map