
QUALITY CONTROL AFTER PROTEIN/PEPTIDE IDENTIFICATION
Click the “View” link under the Misc quality check column.
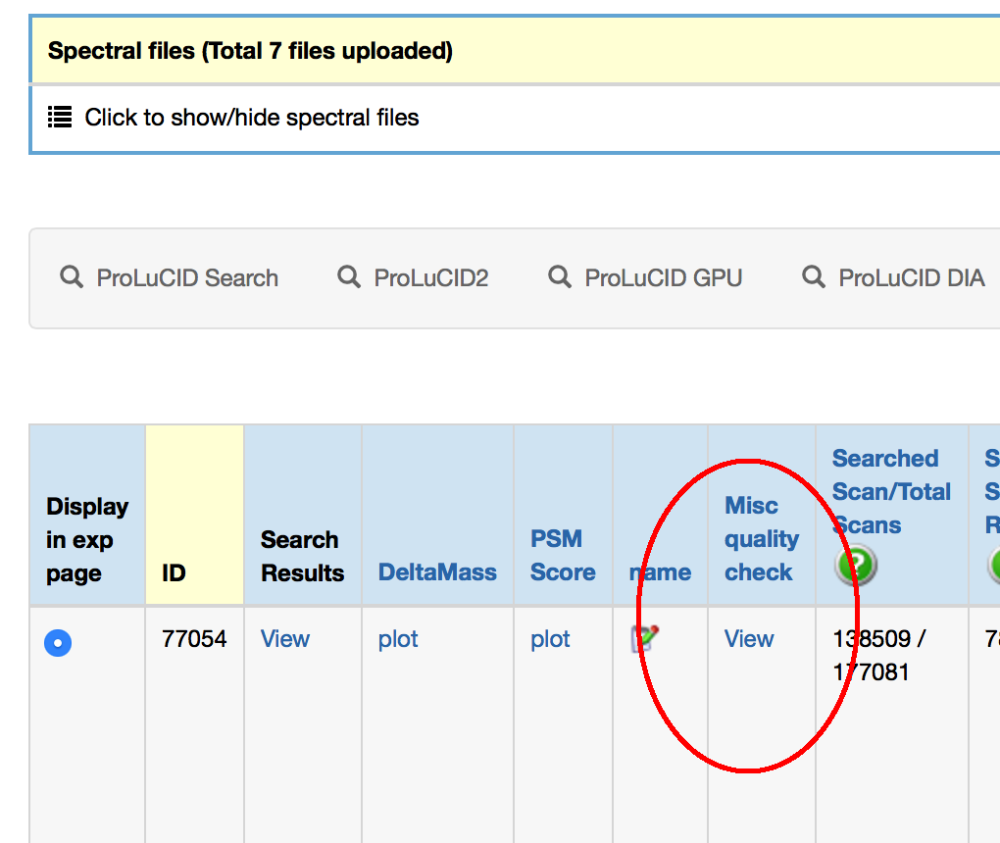
Figure 11.4.1: Search result page
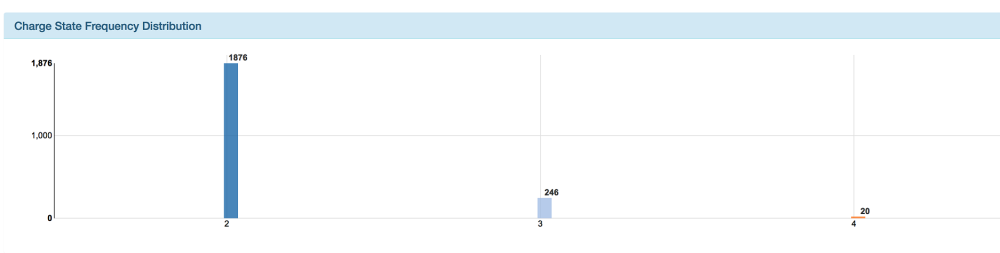
Figure 11.4.2: Charge state distribution
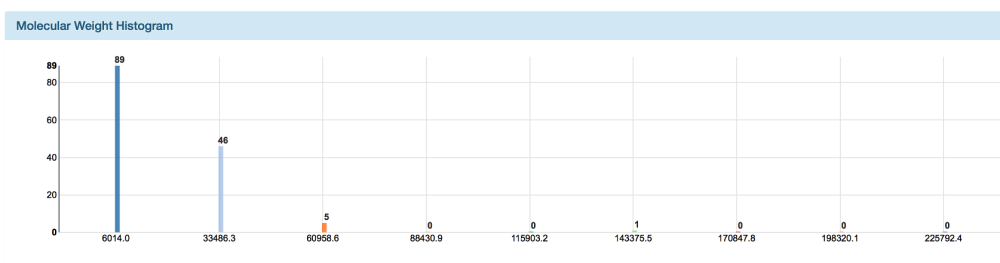
Figure 11.4.3: Molecular Weight Histogram
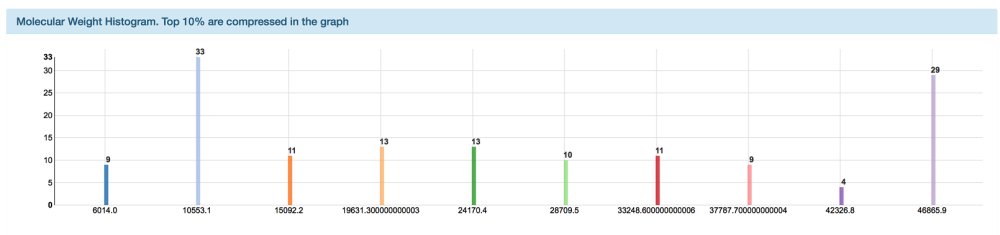
Figure 11.4.4: Molecular Weight Histogram. Top 10% is compressed in the graph
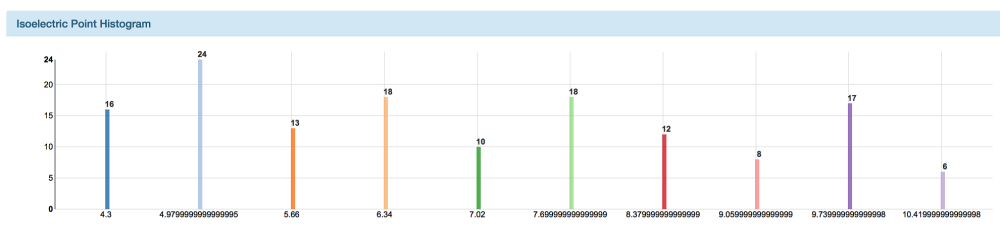
Figure 11.4.5: Isoelectric Point Histogram
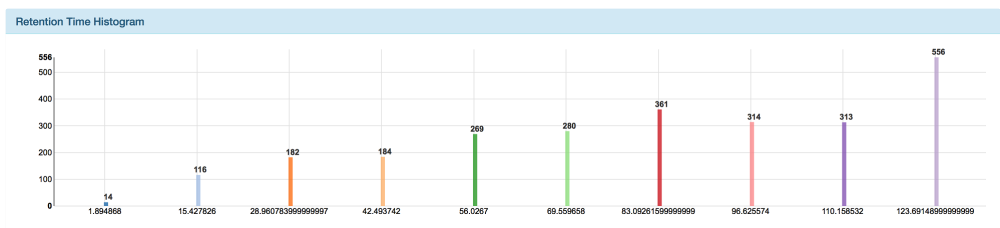
Figure 11.4.6: Retention Time Histogram
Post your comment on this topic.
quality wrote: Apr 8, 2019
Nice Post ! Can you share specific details about the Quality control